US export data 2026: Export products & destination markets
US export data 2026 shows civilian aircraft leading at US$67.46B and crude oil behind at US$62.52B, with Mexico the top partner. Full analysis on TradeInt.

Based on TradeInt's India shipment records, the main exports of India are refined petroleum at US$12.08 billion, followed by smartphones at US$9.23 billion and pharmaceuticals at US$5.61 billion.
The list of India's top exports contains diamonds, rice, jewellery, passenger cars, vehicle parts, gas turbines, and heterocyclic compounds.
Top India exports in Q1 2026:
| Rank | 4-Digit HS Code | Product Name | Value (US$) | Value % | Top Supplier |
|---|---|---|---|---|---|
| 1 | 2710 | Refined petroleum oils and oils obtained from bituminous minerals, other than crude | $12,081,958,592 | 11.24% | RELIANCE INDUSTRIES LIMITED |
| 2 | 8517 | Telephone sets, smartphones, and other apparatus for transmitting or receiving voice or data | $9,225,832,155 | 8.59% | FOXCONN HON HAI TECHNOLOGY INDIA MEGA DEVELOPMENT |
| 3 | 3004 | Medicaments consisting of mixed or unmixed products for therapeutic or prophylactic uses | $5,608,951,274 | 5.22% | PIRAMAL PHARMA LIMITED |
| 4 | 7102 | Diamonds, whether or not worked, but not mounted or set | $3,281,498,775 | 3.05% | SHREE RAMKRISHNA EXPORTS PRIVATE LIMITED |
| 5 | 1006 | Rice, including paddy, husked, semi-milled, wholly milled, or broken variants | $3,232,878,361 | 3.01% | SUPPLE TEK INDUSTRIES PRIVATE LIMITED |
| 6 | 7113 | Articles of jewelry and parts thereof, of precious metal or clad metal | $3,005,120,523 | 2.80% | MALABAR GOLD AND DIAMONDS LIMITED |
| 7 | 8703 | Motor cars and other motor vehicles principally designed for transport of persons | $2,311,624,433 | 2.15% | MARUTI SUZUKI INDIA LIMITED |
| 8 | 8708 | Parts and accessories of motor vehicles of headings 8701 to 8705 | $1,913,833,166 | 1.78% | KIA INDIA PRIVATE LIMITED |
| 9 | 8411 | Turbojets, turbopropellers, and other gas turbines, and structural parts thereof | $1,335,219,660 | 1.24% | INTERGLOBE AVIATION LIMITED |
| 10 | 2933 | Heterocyclic compounds with nitrogen hetero-atom(s) only | $1,270,373,672 | 1.18% | DIVIS LABORATORIES LIMITED |
Data Source: Official TradeInt India Export Data and Bill of Lading Database
Period: January-March 2026
TradeInt is a global trade data platform providing access to over 10 billion verified import and export records. Its coverage spans over 200 countries and more than 80 customs data sources.
This article provides an overview of India’s exports. Use TradeInt to explore more detailed trade records and continue tracking this market as new data becomes available. Search India export records →
India is one of the world's largest buffalo-meat exporters. Search "beef" on TradeInt for India's beef shipments, with exporter names and destination markets with Bill of Lading data records.
Preview here: India's historical beef export records
India's export growth in 2026 is being led by high-value manufacturing rather than raw commodities. Electronics and petroleum products are expanding fastest, reflecting India's push to move up the value chain in global supply.
According to News On Air, India's total exports reached US$80.8 billion in April 2026, up 13.6% year-on-year, with the fastest gains in electronics and fuel.
The forces behind each of India's leading export categories stand out clearly:
✔ Lite ✔ Pro ✔ Premium ✔ Enterprise
TradeInt is a global trade data platform covering 200+ countries and 80+ customs sources.Learn about TradeInt →
India is a major global onion supplier. TradeInt's analysis ranks the top destination countries for India's onion exports, with values, leading HS lines, and the processed-versus-fresh split.
Read now: India exports onion to which country? Top partners & trends
From India export data on TradeInt, India exports mainly to the United States, the United Arab Emirates, and China. The US led in Q1 2026 at US$21.12 billion, the UAE followed at US$8.11 billion, and China came third at US$4.94 billion, based on TradeInt's records.
Other top Indian export partners include Singapore, the United Kingdom, the Netherlands, Germany, Hong Kong, Bangladesh, and Saudi Arabia.
Top India exports by country in Q1 2026:
| Rank | Country | Value (US$) | Value % | Top 4-Digit HS Code Imported | Top Buyer |
|---|---|---|---|---|---|
| 1 | United States | $21,115,383,317 | 19.65% | 8517 | APPLE INC |
| 2 | United Arab Emirates | $8,106,645,903 | 7.54% | 2710 | ADNOC GLOBAL |
| 3 | China | $4,936,432,555 | 4.59% | 7102 | KIRAN EXPORTS HONGKONG LTD |
| 4 | Singapore | $3,789,338,848 | 3.53% | 2710 | QATAR NATIONAL BANK |
| 5 | United Kingdom | $3,299,960,226 | 3.07% | 8517 | TATA ELECTRONICS SYSTEMS SOLUTIONS |
| 6 | Netherlands | $3,164,779,721 | 2.95% | 2710 | NEGOTIATED THROUGH |
| 7 | Germany | $3,007,370,161 | 2.80% | 8708 | PCA SLOVAKIA SRO |
| 8 | Hong Kong, China | $2,462,071,320 | 2.29% | 7102 | KIRAN EXPORTS HONGKONG LTD |
| 9 | Bangladesh | $2,431,133,254 | 2.26% | 5205 | BANK OF BANGLADESH |
| 10 | Saudi Arabia | $2,349,173,452 | 2.19% | 7408 | ALFANAR CABLES BRANCH OF ALFANAR |
Data Source: Official TradeInt India Export Data and Bill of Lading Database
Period: January-March 2026
✔ Lite ✔ Pro ✔ Premium ✔ Enterprise
TradeInt is a global trade data platform covering 200+ countries and 80+ customs sources.Learn about TradeInt →
India's exports to Turkey reached US$3.03 billion in H1 2025, spanning around 3,500 commodities from machinery to chemicals. TradeInt's analysis breaks down the top export categories and the values behind each.
Read more: What does India export to Turkey — H1 2025 insights
India's export map in 2026 is broadening beyond its established Western markets, with fast growth in Asia and Africa reshaping the destination mix.
While the United States remains the dominant single market, the sharpest gains come from smaller, emerging corridors. In fact, India's fastest-growing export destinations by value in May 2026 included Singapore, up 68.96%, and South Africa, up 116.21%.
A closer look at what is moving India's key export factors:
India's tracked export value grew from US$115.04 billion in Q1 2025 to US$107.45 billion in Q1 2026, staying within a narrow band across the period, as analyzed by TradeInt.
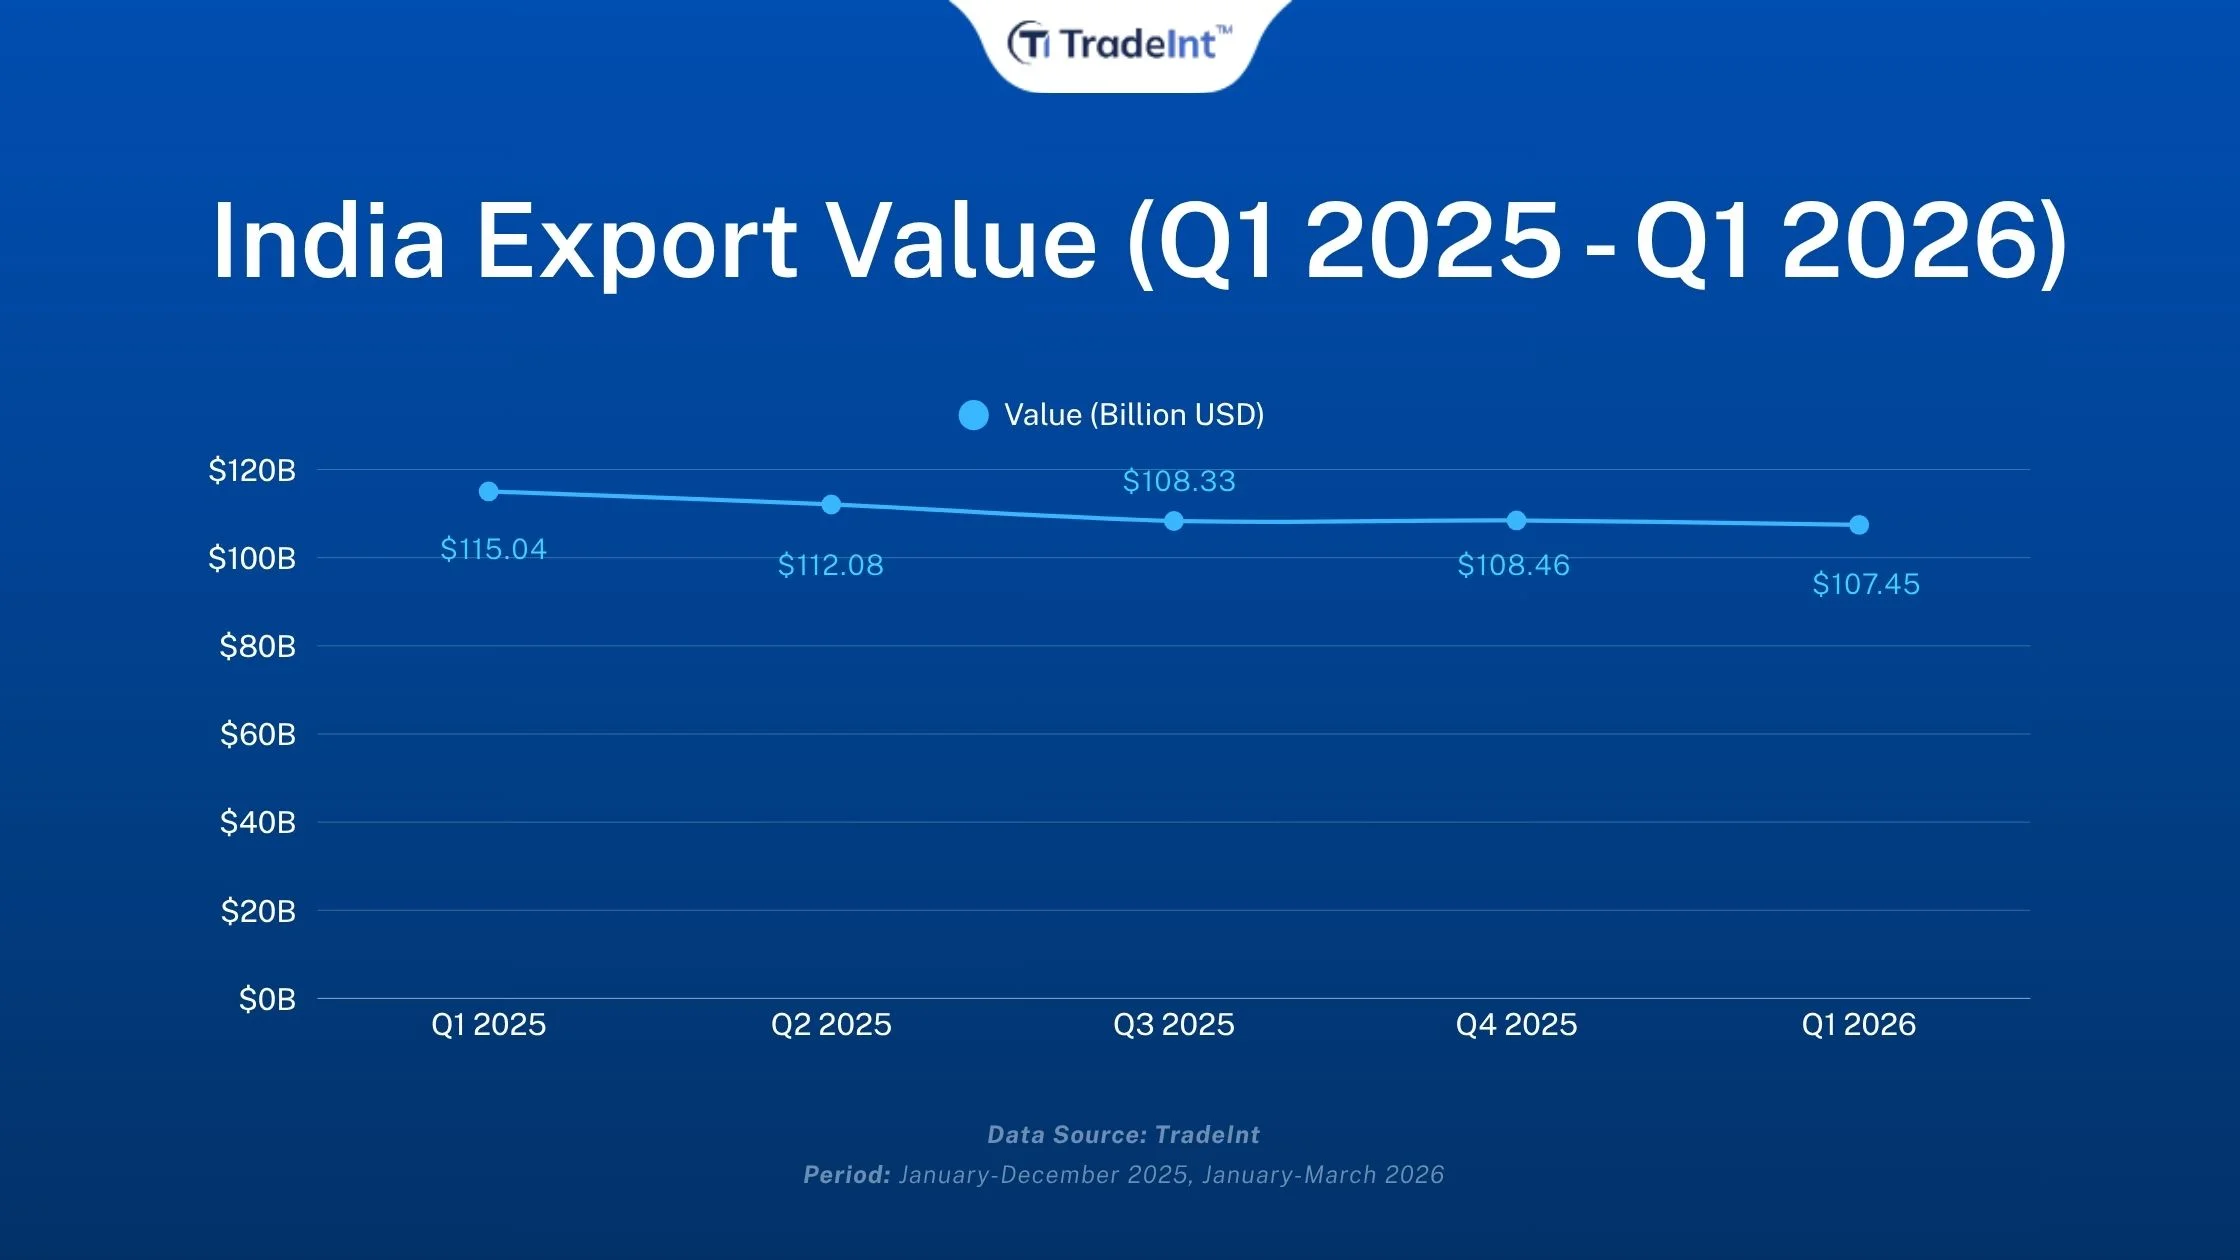
India export value shows steady changes from Q1 2025 to Q2 2026, from official TradeInt's India export data.
| Timeline | Value (US$) | QoQ % |
|---|---|---|
| Q1 2025 | $115.04B | 6.09% |
| Q2 2025 | $112.08B | -2.57% |
| Q3 2025 | $108.33B | -3.35% |
| Q4 2025 | $108.46B | 0.12% |
| Q1 2026 | $107.45B | -0.93% |
Data Source: Official TradeInt India Export Data and Bill of Lading Database
Period: January-December 2025, January-March 2026
✔ Lite ✔ Pro ✔ Premium ✔ Enterprise
TradeInt is a global trade data platform covering 200+ countries and 80+ customs sources.Learn about TradeInt →
TradeInt's universal trade dataset covers shipment records, buyers, and suppliers spanning global import and export corridors, including over 200 countries, and covering up to 97% trade activities worldwide with global mirror data.
Explore TradeInt universal trade data intelligence
India trade slowed through late 2025, yet India's total exports still rose to US$162.69 billion over April-May 2026, up 14.66% year-on-year, according to the Ministry of Commerce. This shows an export economy that is expanding its overall trade even as conditions in individual markets shift.
The forces shaping India's export performance in 2026:
India export data lets a business see how rival exporters operate: which markets they ship to, how often, and through which overseas buyers. This turns competition into a measurable benchmark.
TradeInt structures this from customs and Bill of Lading records covering over 10 billion shipment trade records and 500 million global trade company profiles, so a competitor's export footprint becomes visible at the shipment level.
Practical ways to apply India export data for competitive intelligence:
These capabilities draw on TradeInt's transaction-date shipment records from customs filings, making them suited for competitor mapping, corridor benchmarking, and buyer research rather than real-time alerts.
Access further India trade statistics overview by the top transacted HS code and country trade partner
India's Q1 2026 export profile shows a diversified economy exporting fuel, technology, medicine, and food at scale. Refined petroleum led at US$12.08 billion, smartphones followed at US$9.23 billion, and pharmaceuticals ranked third at US$5.61 billion, while the US, the UAE, and China took the largest values by destination.
For businesses trading with India, the opportunity lies in tracking exactly where these expanding export flows lead next. Book a demo with TradeInt's trade data experts.
India's main export is refined petroleum (HS 2710), valued at US$12.08 billion in Q1 2026. Smartphones and pharmaceuticals follow, reflecting India's mix of energy processing, electronics assembly, and generic-drug manufacturing.
India exports mainly to the United States, the United Arab Emirates, and China. The US is by far the largest market at US$21.12 billion, taking smartphones, pharmaceuticals, and jewellery.
India is consistently among the world's largest exporters of beef and buffalo meat, often ranking in the top two or three globally by volume. India's beef and buffalo-meat exports serve markets across Asia and the Middle East, and can be tracked by destination in TradeInt's India export data.
US export data 2026 shows civilian aircraft leading at US$67.46B and crude oil behind at US$62.52B, with Mexico the top partner. Full analysis on TradeInt.
Indonesia furniture export data for Q1 2026 shows other furniture leading at US$252.53M and seats at US$200.29M, the US the top partner. Full data on TradeInt.
India imports pulses from which countries? Australia leads at US$1.42B (21.77%), with Canada and Myanmar close behind. Full HS 0713 breakdown on TradeInt.
India exports rice to which countries? Saudi Arabia leads at US$125.83M (11.71%), with UAE and Iran close behind. Full HS 1006 breakdown on TradeInt.
India imports urea from which countries? China leads at US$175.70M (22.09%), with Russia and Oman close behind. Full HS 310210 breakdown on TradeInt.
TradeInt India import data Q1 2026: crude petroleum led at US$29.64B, followed by gold at US$22.58B and ICs at US$8.27B; China top partner.