Key takeaways: India Rice Export Data 2026
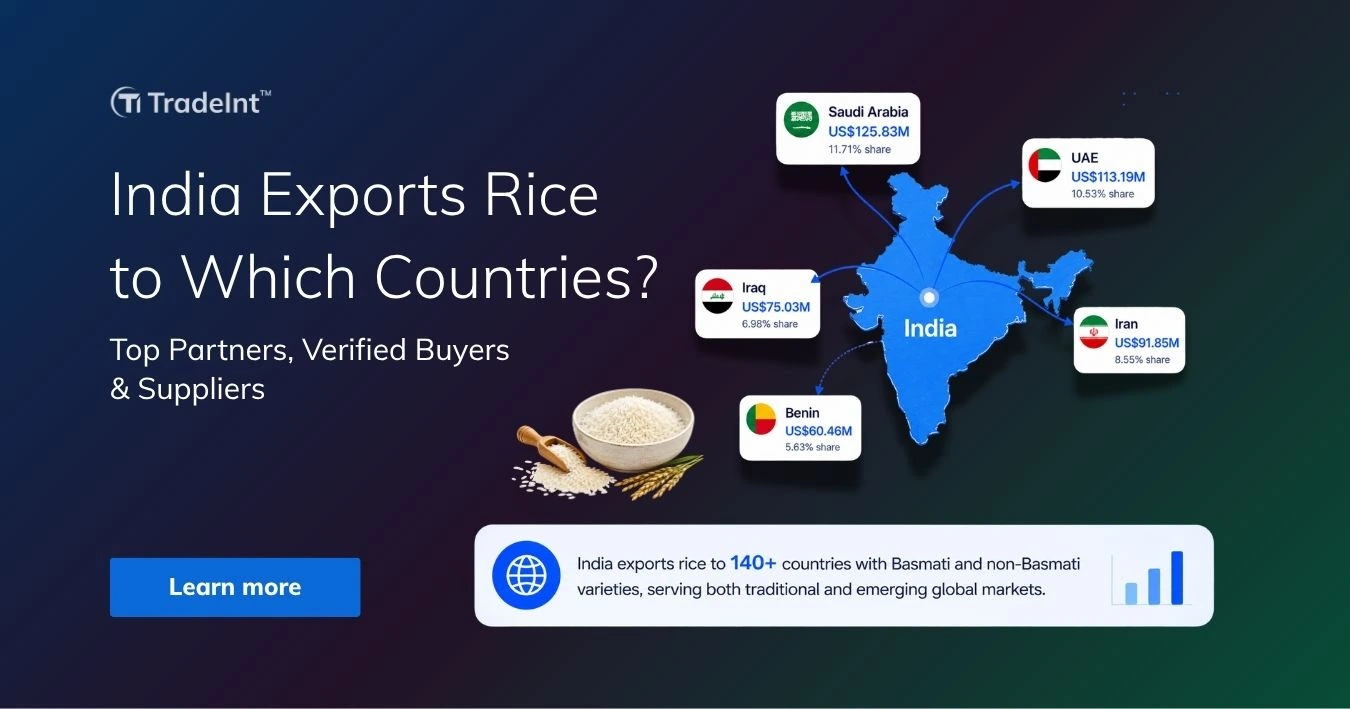
- Saudi Arabia leads India export rice to which countries in Q1 2026 at US$125.83 million (11.71%), followed by the UAE (US$113.19 million, 10.53%) and Iran (US$91.85 million, 8.55%), drawn from TradeInt's dataset.
- Wholly or semi-milled rice (HS 100630), the Basmati and milled non-Basmati segment, dominates India's rice export basket at US$1.01 billion (94.22%) in Q1 2026, with broken rice (HS 100640) accounting for US$43.93 million (4.09%).
- India remained the world's largest rice exporter in 2025 with 53.56% of global rice trade by value at US$10.11 billion, more than double the combined exports of Vietnam (US$3.61 billion) and Pakistan (US$2.42 billion).
Which countries does India export rice to in Q1/2026?
India mainly exports rice to Saudi Arabia valued at US$125.83 million, the UAE at US$113.19 million, and Iran at US$91.85 million, powered by transaction records captured in TradeInt's India trade database.
According to Infoarroz citing Financial Express May 2026, India shipped rice valued at US$1.01 billion in April 2026, a 6% year-on-year decline, as Middle East regional conflict disrupted Basmati exports to Gulf destinations including Saudi Arabia and Iran.
Top 5 Indian rice exporting markets in Q1 2026:
- Saudi Arabia: US$125.83 million (11.71% share). The largest single buyer, with Basmati and milled-rice volumes anchoring Saudi food security procurement through state and private mill orders.
- UAE: US$113.19 million (10.53% share). Operates as both end consumer and regional re-export hub, channelling Indian rice into MENA retail and Iranian-origin freight rerouting through Jebel Ali and Dubai.
- Iran: US$91.85 million (8.55% share). A direct Basmati buyer for domestic consumption, with Q1 2026 volumes affected by Strait of Hormuz shipping freight surges.
- Iraq: US$75.03 million (6.98% share). State-led procurement through the Iraqi Grain Board sources Indian milled rice for the Public Distribution System across all 18 provinces.
- Benin: US$60.46 million (5.63% share). West African gateway through the Port of Cotonou, with Indian rice transiting into Niger, Nigeria, and Burkina Faso retail markets.

TradeInt is a global trade data platform providing access to over 10 billion verified import and export records. Its coverage spans over 200 countries and more than 80 customs data sources.
This article provides an overview of India’s rice exports. Use TradeInt to explore more detailed trade records and continue tracking this market as new data becomes available. Search India rice export records →
📈 India is #1 Rice Exporter in 2024-2025, according to TradeInt's Analysis
TradeInt's market analysis ranks India as the world's largest rice exporter at 53.56% of global rice trade by value in 2025, with US$10.11 billion in shipments, more than double Vietnam and Pakistan combined as the next leading origins.
Read more: Top Rice Exporting Countries 2024-2025
Top 1 - Saudi Arabia: US$125.83 million
Saudi Arabia received US$125.83 million in Indian rice during Q1 2026, from TradeInt's dataset. Wholly or semi-milled rice (HS 100630) made up the entire flow at US$125.83 million (100%), with broken rice (HS 100640) at just US$1,100, reflecting Saudi Arabia's strong preference for premium Basmati and milled rice over fragmented varieties.
Main India rice export types to Saudi Arabia (Q1 2026)
- HS 100630 - Wholly or semi-milled rice: US$125.83 million (100%) - Includes premium 1121 and 1509 Basmati varieties shipped through Mundra and JNPT ports for Saudi retail, food service, and state procurement channels.
- HS 100640 - Broken rice: US$1,1000 - A negligible flow, with Saudi importers consistently preferring whole-kernel milled rice over fragmented broken-rice classes.
Saudi Arabia anchors India's premium Basmati pipeline with a near-exclusive focus on milled rice procurement. According to Infoarroz citing Financial Express, India's rice exports declined in 2026 as Middle East shipping disruptions affected Basmati flows to Gulf destinations.
In fact, freight economics shifted mid-quarter sharply.
Ocean freight to the Gulf surged from around US$500 to US$5,000 per 25-tonne container since March 2026, pressuring exporter margins on Saudi-bound shipments.
✔ Lite ✔ Pro ✔ Premium ✔ EnterpriseTradeInt is a global trade data platform covering 200+ countries and 80+ customs sources. Learn about TradeInt →
🛢️ Preview Saudi Arabia's Trade Summary on TradeInt
TradeInt's Saudi Arabia trade summary outlines annual import-export statistics, including food imports flowing through Jeddah Islamic Port and King Abdullah Port under the GCC trade framework administered by ZATCA.
Check out: Saudi Arabia past shipment data
Top 2 - United Arab Emirates: US$113.19 million
Within Q1 2026, the UAE imported US$113.19 million in Indian rice across four HS subcategories, almost entirely concentrated in wholly or semi-milled rice (HS 100630) at US$112.79 million (99.65%). Broken rice (HS 100640) added US$389,880, with husked brown rice and paddy rice contributing minor volumes, according to TradeInt's records for the quarter.
Main India rice export types to UAE (Q1 2026)
- HS 100630 - Wholly or semi-milled rice: US$112.79 million (99.65%). Routes through Jebel Ali and Dubai ports for both UAE domestic retail and re-export across MENA regional buyers.
- HS 100640 - Broken rice: US$389,880 (0.34%). A minor channel into UAE catering and food processing operations where lower-cost rice fragments meet bulk-meal demand.
- HS 100620 - Husked brown rice: US$10,817 (0.01%). A specialty health-segment line sold through premium UAE retail networks.
- HS 100610 - Paddy rice: US$820 (0.00%). A trace volume, since the UAE has no domestic milling base for rough rice processing at scale.
The UAE plays a dual role as both end consumer and regional re-export hub. Indian rice cleared through Jebel Ali and Dubai serves UAE retail and food service while also being redistributed across neighbouring MENA markets.
However, re-export economies have been pressured by Gulf shipping disruption.
According to Infoarroz, ocean freight to the Gulf surged tenfold since March 2026, with UAE-based traders facing the same cost inflation as direct Saudi-bound shipments.
Top 3 - Iran: US$91.85 million
TradeInt's records show Iran imported US$91.85 million in Indian rice during Q1 2026, with wholly or semi-milled rice (HS 100630) at US$90.23 million (98.24%) and broken rice (HS 100640) at US$1.62 million (1.76%). Iran has historically been a primary Basmati destination, though Q1 2026 volumes reflect shipping channel adjustments through the Strait of Hormuz.
Main India rice export types to Iran (Q1 2026)
- HS 100630 - Wholly or semi-milled rice: US$90.23 million (98.24%). Includes premium aromatic Basmati varieties for Iranian retail and government distribution programs.
- HS 100640 - Broken rice: US$1.62 million (1.76%). A smaller but consistent volume entering Iranian food processing and lower-cost consumer channels.
✔ Lite ✔ Pro ✔ Premium ✔ EnterpriseTradeInt is a global trade data platform covering 200+ countries and 80+ customs sources. Learn about TradeInt →
🌾 Search India Rice Export Trade Records on TradeInt
TradeInt's India export database covers HS 1006 transaction records across all destination markets, helping exporters, brokers, and importers cross-check shipment-level transaction-date records, buyer companies, and milled-rice volumes by classification.
Preview now: India rice export records search by product
Iran ranks among India's top three Basmati destinations historically, though Q1 2026 volumes were materially affected by Strait of Hormuz shipping conditions. As stated by Infoarroz citing Financial Express, 2026 Middle East regional conflict disrupted Basmati shipments to Gulf countries, including Iran.
Meanwhile, freight escalation hit Iran-bound shipments.
Ocean freight to the Gulf rose to around US$5,000 per 25-tonne container, with Strait of Hormuz route adjustments adding further timing variability to direct Iranian deliveries.
Top 4 - Iraq: US$75.03 million
Public food distribution drove Iraq's US$75.03 million Indian rice imports during Q1 2026. Wholly or semi-milled rice (HS 100630) covered US$74.99 million (99.95%), with husked brown rice (HS 100620) at US$38,252, drawn from TradeInt's quarterly transaction records. Iraq's state grain procurement underpins consistent demand for milled-rice consignments.
Main India rice export types to Iraq (Q1 2026)
- HS 100630 - Wholly or semi-milled rice: US$74.99 million (99.95%). Channelled into Iraq's Public Distribution System and Iraqi Grain Board procurement for monthly food rations across all 18 provinces.
- HS 100620 - Husked brown rice: US$38,252 (0.05%). A negligible specialty line, falling outside Iraq's mainstream PDS rice category specifications.
Iraq's Indian rice procurement runs primarily through state channels rather than open commercial trade. In fact, rice export from India to Middle Eastern countries saw a 49% year-on-year decline in FY26 on freight escalation and Gulf shipping disruption.
Public Distribution System procurement provides ballast against open-market volatility. Iraqi Grain Board tender purchases follow scheduled cycles supporting public food ration distribution, smoothing quarterly variations despite the 2026 freight inflation.
Top 5 - Benin: US$60.46 million
Benin received US$60.46 million in Indian rice during Q1 2026, operating as West Africa's largest single re-export gateway. Wholly or semi-milled rice (HS 100630) made up US$60.29 million (99.72%) of the flow, with broken rice (HS 100640) at US$170,179, from TradeInt's global trade data.
Main India rice export types to Benin (Q1 2026)
- HS 100630 - Wholly or semi-milled rice: US$60.29 million (99.72%). Flows through the Port of Cotonou for redistribution to Nigeria, Niger, Togo, and Burkina Faso retail networks across West Africa.
- HS 100640 - Broken rice: US$170,179 (0.28%). A minor catering and food processing line, with limited inland transit beyond Cotonou's immediate hinterland.
Benin's role as a West African rice gateway depends on cross-border re-export economics. In 2024, India exported approximately 9 million tonnes of rice to Africa, worth US$4.5 billion, nearly half of India's global rice export volume.
These regulatory shifts at Cotonou are reshaping near-term flows. Benin's new rice import rules may disrupt Cotonou shipments, potentially redirecting volumes to alternative West African ports.
What percentage of India's rice is exported?
India ranked as the world's largest rice exporter in 2025 at US$10.11 billion, representing 53.56% of global rice export value. Vietnam followed at US$3.61 billion (19.11%) and Pakistan at US$2.42 billion (12.84%), according to TradeInt's global rice trade database from January to December 2025.
Global rice exports market in 2025:
- India: US$10.11 billion (53.56%). The dominant origin in the global rice trade, exporting both aromatic Basmati and non-Basmati varieties to over 140 destination countries.
- Vietnam: US$3.61 billion (19.11%). Concentrates in milled white rice for Southeast Asian and African buyers, the second-largest export origin globally.
- Pakistan: US$2.42 billion (12.84%). A Basmati-focused exporter competing directly with India in Gulf and Middle East markets.
- Uruguay: US$779 million (4.13%). South America's leading rice exporter, supplying Brazil, Mexico, and select African importers.
- Brazil: US$500 million (2.65%). Anchors South American intra-regional rice flows, with peripheral exports to West African destinations.
✔ Lite ✔ Pro ✔ Premium ✔ EnterpriseTradeInt is a global trade data platform covering 200+ countries and 80+ customs sources. Learn about TradeInt →
🌍 Uncover India HS 1006 Rice Export Records on TradeInt
TradeInt's HS 1006 export database surfaces shipment-level milled-rice, broken-rice, and Basmati transaction-date records destined for Saudi Arabia, the UAE, Iran, Iraq, Benin, and 140+ other Indian rice destinations worldwide.
Search now: India HS 1006 past export trade records
Which type of rice does India export?
Wholly or semi-milled rice (HS 100630), the Basmati and milled non-Basmati segment, dominates India's rice exports at US$1.01 billion (94.22%) in Q1 2026. Broken rice (HS 100640) follows at US$43.93 million (4.09%), with paddy rice (HS 100610) and husked brown rice (HS 100620) contributing smaller volumes, as stated by TradeInt's quarterly records.
Top 5 rice exporting types in India (2025)
- HS 100630 - Wholly or semi-milled rice: US$1.01 billion (94.22%). Includes premium 1121 and 1509 Basmati for Gulf markets and milled non-Basmati varieties for African, US, and select Asian buyers including Japan.
- HS 100640 - Broken rice: US$43.93 million (4.09%). The cost-sensitive segment, primarily destined for African food processing and lower-income retail markets.
- HS 100610 - Paddy rice: US$17.80 million (1.66%). Rough unhusked rice for processing markets that operate their own milling infrastructure.
- HS 100620 - Husked brown rice: US$358,308 (0.03%). The smallest channel, supplying specialty health-segment retail in select markets including the US, Japan, and parts of China.
Who is the largest producer of rice in India in 2026? Top 5 Indian rice suppliers
The list of verified rice suppliers on TradeInt reveals that Suppletek Industries Private Limited leads India's rice exporter ranking in Q1 2026 with 4.41% share of total rice exports, followed by D D International Private Limited (United States, 2.88%) and Shiv Shakti Inter Globe Exports (2.29%).
Top 5 Indian rice suppliers in Q1 2026:
- Suppletek Industries Private Limited (Maldives): Positioned as a leading exporter of premium Indian Basmati, with primary destination flows into the Maldives and broader South Asian retail.
- D D International Private Limited (United States): A modern processor exporting premium quality Basmati rice to US retail and food service buyers.
- Shiv Shakti Inter Globe Exports Private Limited: A three-star export house managing large-scale procurement and milling operations across multiple Indian rice belts.
- ITC Limited (United States): The Indian conglomerate exporting high-quality agricultural staples through its extensive sourcing and processing network.
- Louis Dreyfus Company India Private Limited (Belgium): The Indian subsidiary of the global agricultural merchant, leading Belgium-bound and onward European rice consignments.
✔ Lite ✔ Pro ✔ Premium ✔ EnterpriseTradeInt is a global trade data platform covering 200+ countries and 80+ customs sources. Learn about TradeInt →
📥 See TradeInt's Verified Rice Buyers In India Through Data Demo
TradeInt provides free preview samples of India's HS 1006 export records, helping exporters, importers, and analysts review the data fields, time ranges, and country coverage across 220+ classified destinations.
Download now: India trade data sample
Conclusion
Saudi Arabia leads at US$125.83 million (11.71%), followed by the UAE (US$113.19 million, 10.53%) and Iran (US$91.85 million, 8.55%). Middle East buyers anchor the Basmati channel while West Africa absorbs non-Basmati volumes, sustaining India's position as the world's dominant rice exporter with 53.56% of global rice trade by value in 2025.
TradeInt's countries covered page lists import-export data availability across 220+ countries, with data fields, time ranges, and sample downloads for each destination market in India's rice export network. Get global import export country data coverage.
Frequently asked questions
Who is the biggest importer of rice from India?
Saudi Arabia is the largest single importer of Indian rice in Q1 2026 at US$125.83 million, based on TradeInt's global rice shipment records. The UAE follows at US$113.19 million and Iran at US$91.85 million, with the three buyers together covering 30.79% of India's total HS 1006 rice export value for the quarter.
Which rice can be exported from India?
India exports four HS 1006 rice classifications, with wholly or semi-milled rice (HS 100630), covering Basmati and parboiled non-Basmati varieties, dominating at US$1.01 billion (94.22%) of Q1 2026 export value, as stated by TradeInt's India export records. Broken rice (HS 100640) accounts for 4.09%, paddy rice (HS 100610) for 1.66%, and husked brown rice (HS 100620) for the remaining 0.03%.
Other relevant articles about Import & Export in India
- India export data: Top exports analysis in Q1/2026
- India import data Q1 2026: Top import partners & categories
- India imports coal from which countries? Top partners
- India imports edible oil from which countries in Q1/2026?
- India imports gold from which countries in Q1/2026?
- India imports lithium from which country? Top suppliers
- India imports fertilizer from which countries in Q1 2026?
- India imports crude oil from which countries in Q1 2026?
- India imports petrol from which countries? Top sources 2026
- India exports onion to which country? Top partners & trends
- India imports urea from which countries in Q1 2026?