Importers of rice in USA: Who imports rice to the USA?
Top importers of rice in USA Q1 2026 are: DAESANG AMERICA (16.04%), MAPEI CARIBE (11.03%) lead. South Korea, Thailand, India anchor origins. TradeInt analysis.

India exported the most pharmaceuticals to the U.S. in 2025 at US$13.39 billion, followed by Germany at US$7.83 billion and Belgium at US$5.14 billion.
Combined, the three suppliers account for roughly 36.29% of total U.S. pharmaceutical import value, with the remaining flow split across China, South Korea, and other European and Asian partners across HS codes 3001–3006, based on shipment-level records verified through official TradeInt's verified global trade database.
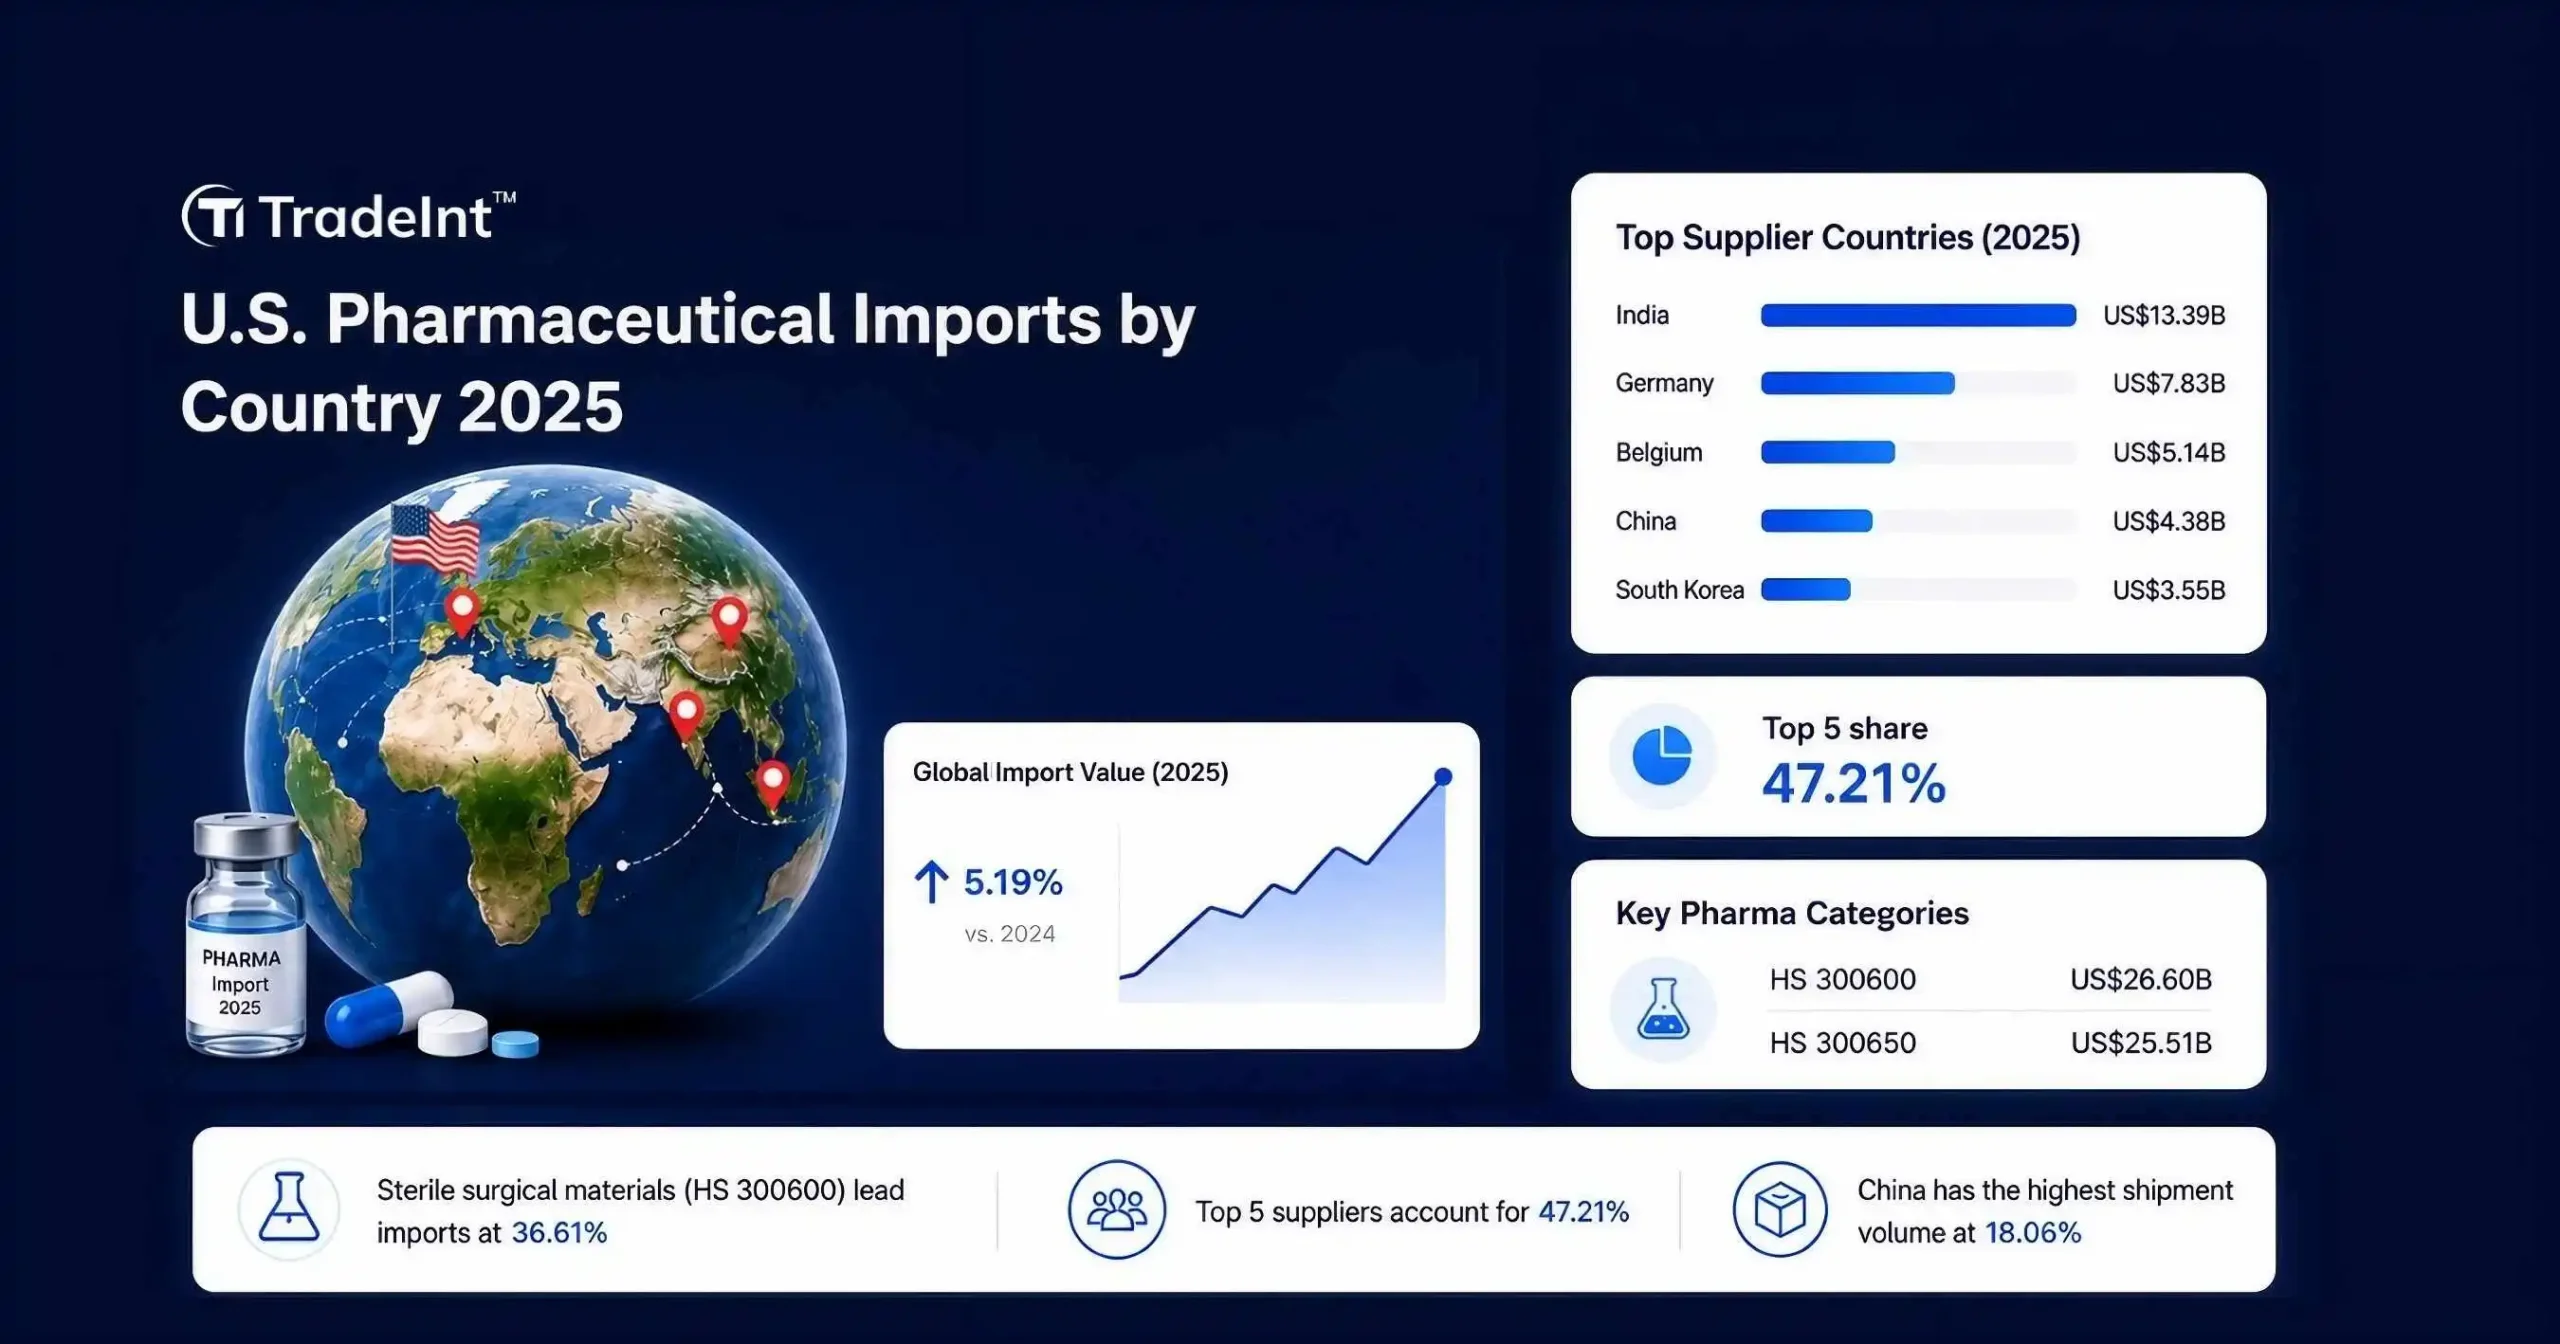
Source: TradeInt Global Trade Intelligence Platform
| Rank | Country of Origins | Import Value, USD | Qty share % | Shipment share | Key 4-Digit HS codes |
|---|---|---|---|---|---|
| 1 | India | 13,394,924,337 | 18.44% | 15.03% | 1. 3006 |
| 2 | Germany | 7,828,043,213 | 10.77% | 7.48% | 1. 3006 |
| 3 | Belgium | 5,144,212,930 | 7.08% | 6.86% | 1. 3006 |
| 4 | China | 4,384,370,036 | 6.03% | 18.06% | 1. 3006 |
| 5 | South Korea | 3,549,606,289 | 4.89% | 4.24% | 1. 3006 |
| 6 | Italy | 3,424,286,386 | 4.71% | 3.53% | 1. 3006 |
| 7 | France | 2,735,919,092 | 3.77% | 3.27% | 1. 3006 |
| 8 | Dominican | 2,728,783,731 | 3.76% | 2.73% | 1. 3006 |
| 9 | Netherlands | 2,612,648,143 | 3.60% | 3.25% | 1. 3006 |
| 10 | Guatemala | 2,295,568,930 | 3.16% | 0.86% | 1. 3006 |
Data source: TradeInt
EU members combined (Germany, Belgium, Italy, France, and the Netherlands) supply 29.93% of pharmaceutical imports to the US by country value, while India alone covers another 18.44%.
According to India Briefing's 2025-26 tariff analysis, around 53% of patented drugs consumed in the U.S. are manufactured abroad, and only 15% of active pharmaceutical ingredients are produced domestically by volume, underscoring the structural dependence on these supplier lanes.
However, U.S. tariff policy is the defining variable for 2025 flows.
The Swissinfo's 2025 timeline news discussed that a 100% U.S. tariff on branded and patented pharmaceutical products took effect on October 1, 2025, with construction-stage U.S. manufacturing plants exempted. Generic drugs were subsequently excluded, keeping India's high-volume generic channel (roughly 47% of U.S. generic prescriptions per IQVIA data cited by Business Today) largely intact.
On the other hand, China's 18.06% shipment share is against a 6.03% quantity share, signaling high-frequency, lower-unit-value flows (APIs, bulk excipients, and packaging-stage materials), a movement that the Atlantic Council links to deepening bilateral upstream dependence in the U.S.
TradeInt is a global trade data platform providing access to over 10 billion verified import and export records. Its coverage spans over 200 countries and more than 80 customs data sources.
This article provides an overview of US pharmaceutical imports. Use TradeInt to explore more detailed trade records and continue tracking this market as new data becomes available. Search US pharmaceutical import records →
📊 U.S. Import Export Data Insight 2025 by TradeInt
Mexico topped U.S. suppliers in 2025 at US$522.13 billion (15.55% of total imports), powered by deep supply chain integration in machinery and vehicles.
On the other side, the U.S. exported “Drug” products worth $101.17B (4.66% share) in 2025, ranking it as the 8th largest export category in the country’s trade structure (as shown in TradeInt data).
💡 Read more: U.S. Import Data 2025 | U.S. Export Data 2025
US$13.39 billion of U.S. pharmaceutical value was imported to the U.S. from India in 2025. The most demanding products are sterile surgical materials at US$7.25 billion, 54.15%, first-aid kits at US$2.24 billion, 16.69%, and hormone-based products with US$2.00 billion, 14.94%.
Top 5 pharmaceutical product categories from India to the U.S. in 2025:
| Key 6-digit HS Code | Value (US$) | Value share % | Economic importance |
|---|---|---|---|
| 300600 | $7,252,700,436 | 54.15% | Diversifies the supply of critical sterile materials, mitigating the risk of domestic shortages in surgery and wound care. |
| 300650 | $2,236,237,045 | 16.69% | Ensures a cost-effective, reliable supply of essential emergency materials for public health and safety sectors. |
| 300660 | $2,001,754,634 | 14.94% | Increases affordability of family planning products, supporting public health initiatives through competitive global pricing. |
| 300630 | $477,090,951 | 5.60% | Lowers costs for medical imaging and diagnostics, reducing overhead for hospitals and healthcare providers. |
| 300400 | $391,620,290 | 2.92% | Provides high-volume generic drugs, drastically reducing US healthcare costs and improving patient treatment accessibility |
Data source: TradeInt
✔ Lite ✔ Pro ✔ Premium ✔ Enterprise
TradeInt is a global trade data platform covering 200+ countries and 80+ customs sources.Learn about TradeInt →
TradeInt covers 200+ countries and over 10 billion global shipping records sourced from authoritative customs, giving exporters and importers verified visibility into pharmaceutical shipment lanes, from Germany's HS 300650 first-aid systems to India's HS 300600 sterile materials.
Explore: Global Pharmaceutical Goods Trade Records on TradeInt
Key dynamics shaping India-to-U.S. pharmaceutical imports in 2025-2026:
Germany ranks second in U.S. pharmaceutical imports by country in 2025, exporting US$7.83 billion. The flow is led by HS 300650 (first-aid kits, US$3.27 billion, 41.76%), HS 300600 (sterile surgical materials, US$2.50 billion, 31.88%), and HS 300660 (hormone-based products, US$553 million, 7.06%).
Top 5 pharmaceutical product categories from Germany to the U.S. in 2025:
| Key 6-digit HS Code | Value (US$) | Value share % | Economic importance |
|---|---|---|---|
| 300650 | $3,268,627,912 | 41.76% | Ensures premium emergency preparedness through standardized kits meeting rigorous US safety regulations for first-response and industrial sectors. |
| 300600 | $2,495,313,244 | 31.88% | Secures the US supply chain for niche sterile products, leveraging German manufacturing precision to prevent critical hospital shortages. |
| 300660 | $553,020,712 | 7.06% | Strengthens US family planning markets by providing high-standard, hormone-based products that strictly comply with 2025 FDA quality benchmarks. |
| 300610 | $374,498,450 | 4.78% | Crucial for US surgical outcomes; German precision-engineered sutures provide the reliability needed for complex, high-stakes medical operations |
| 300630 | $357,899,982 | 4.57% | Vital for high-resolution US medical imaging; German reagents ensure the consistency required for accurate, early-stage disease diagnosis |
Data source: TradeInt
Key dynamics shaping Germany-to-U.S. pharmaceutical imports in 2025-2026:
Belgium is the third-largest source of U.S. pharmaceutical imports by country in 2025, exporting US$5.14 billion. The top products are split nearly evenly between HS 300600 (sterile surgical materials, US$2.19 billion, 42.59%) and HS 300650 (first-aid kits, US$2.18 billion, 42.43%), with HS 300660 (hormone-based products, US$247 million, 4.80%) ranking 3rd.
Top 5 pharmaceutical product categories from Belgium to the U.S. in 2025:
| Key 6-digit HS Code | Value (US$) | Value share % | Economic importance |
|---|---|---|---|
| 300600 | $2,190,685,433 | 42.59% | Provides specialized sterile surgical materials, leveraging Belgian manufacturing precision to secure US hospital supply chains against global shortages. |
| 300650 | $2,182,810,423 | 42.43% | Ensures premium emergency preparedness via high-standard kits, supporting US workplace safety and regulatory compliance through reliable European logistics. |
| 300660 | $247,086,917 | 4.80% | Secures US access to high-quality hormonal contraceptives, fostering market stability and public health through Belgium's advanced biopharmaceutical production. |
| 300640 | $107,329,590 | 2.09% | Vital for US dental healthcare; provides high-performance cements essential for restorative procedures and skeletal reconstruction in specialized clinics. |
| 300500 | $100,664,940 | 1.96% | Guarantees high-grade clinical wound care supplies, bolstering US healthcare resilience through Belgium's global-leading pharmaceutical distribution and logistics. |
Data source: TradeInt
✔ Lite ✔ Pro ✔ Premium ✔ Enterprise
TradeInt is a global trade data platform covering 200+ countries and 80+ customs sources.Learn about TradeInt →
Access TradeInt's verified shipment records covering HS 3006, 3005, and 3004 to track Belgian pharmaceutical exports, identify buyers, and benchmark unit values against European peer countries.
💡 Explore: Belgium 3006 export trade records preview
Key dynamics shaping Belgium-to-U.S. pharmaceutical imports in 2025-2026:
U.S. pharmaceutical imports from China were valued at US$4.38 billion in 2025, but it holds the largest shipment share at 18.06%, exceeding India's 15.03%. Among the top importing products, HS 300650 (first-aid kits, US$1.89 billion, 35.31%) accounted for the highest in value, HS 300600 (sterile surgical materials, US$1.34 billion, 25.02%), and HS 300630 (diagnostic reagents, US$479 million, 8.95%).
Top 5 pharmaceutical product categories from China tothe U.S. in 2025:
| Key 6-digit HS Code | Value (US$) | Value share % | Economic importance |
|---|---|---|---|
| 300650 | $1,891,038,617 | 35.31% | Provides affordable, mass-market emergency supplies, ensuring US workplaces and homes maintain safety standards at significantly lower costs. |
| 300600 | $1,339,969,112 | 25.02% | Secures high-volume sterile surgical essentials, helping US hospitals stabilize inventory and mitigate price spikes for routine medical care. |
| 300630 | $479,308,149 | 8.95% | Lowers US medical imaging expenses by supplying affordable reagents, facilitating high-volume, low-cost screening for millions of patients |
| 300660 | $477,090,951 | 8.91% | Enhances reproductive health accessibility by providing cost-effective hormonal options, preventing domestic price surges through strong global competition. |
| 300640 | $340,616,710 | 6.36% | Supplies cost-efficient restorative materials for US dental clinics, reducing overhead for providers and patient costs for routine care. |
Data source: TradeInt
✔ Lite ✔ Pro ✔ Premium ✔ Enterprise
TradeInt is a global trade data platform covering 200+ countries and 80+ customs sources.Learn about TradeInt →
TradeInt's solutions help importers verify Chinese pharmaceutical suppliers, decode 10+ billion shipment records, and identify alternative sourcing options across 200+ countries, built for exporters and importers navigating evolving supply chain dynamics in 2025-2026.
💡 Read more: Global Buyer and Supplier Directory
Key dynamics shaping China-to-U.S. pharmaceutical imports in 2025-2026:
South Korea is the fifth-largest source of U.S. pharmaceutical imports by country in 2025, exporting US$3.55 billion. HS 300600 (sterile surgical materials, US$1.85 billion, 52.24%) is the highest-value product imported; next are HS 300650 (first-aid kits, US$761 million, 21.44%) and HS 300640 (dental cements, US$204 million, 5.75%).
Top 5 pharmaceutical product categories from South Korea tothe U.S. in 2025:
| Key 6-digit HS Code | Value (US$) | Value share % | Economic importance |
|---|---|---|---|
| 300600 | $1,854,474,412 | 52.24% | Provides high-quality sterile surgical essentials, supporting US clinical safety and mitigating risks of hospital supply chain disruptions. |
| 300650 | $760,931,282 | 21.44% | Secures reliable, high-standard emergency supplies for US industrial and consumer sectors, ensuring consistent public safety and preparedness. |
| 300640 | $204,198,305 | 5.75% | Vital for the US dental industry; South Korea's high-precision restorative materials drive down costs for specialized clinics. |
| 300660 | $197,451,407 | 5.56% | Stabilizes the US reproductive health market by providing cost-effective, high-quality hormonal products that meet strict FDA regulatory standards. |
| 300590 | $114,871,912 | 3.24% | Delivers innovative, bio-compatible wound care solutions, leveraging South Korea’s medical technology to enhance US patient recovery and efficiency. |
Data source: TradeInt
Key dynamics shaping South Korea-to-U.S. pharmaceutical imports in 2025-2026:
U.S. pharmaceutical imports by country in 2025 remain heavily concentrated among five suppliers — India (US$13.39 billion, 18.44%), Germany (US$7.83 billion, 10.77%), and Belgium (US$5.14 billion, 7.08%) lead the ranking, followed by China and South Korea. On the product side, sterile surgical materials (HS 300600, US$26.60 billion), first-aid boxes and kits (HS 300650, US$25.51 billion), and hormone-based pharmaceutical products (HS 300660, US$5.87 billion) anchor 79.80% of total U.S. pharmaceutical import value.
The data confirms a multi-source, multi-category supplier base supporting U.S. hospital procurement, emergency preparedness, and retail pharmacy channels through 2025-2026.
To verify pharmaceutical imports to the US by country at the shipment level, identify suppliers by HS code, product name, or company name, and benchmark unit values across 200+ countries, book a demo with TradeInt.
The U.S. imported approximately US$72.6 billion in pharmaceuticals across the top 10 source countries in 2025, from TradeInt data. Sterile surgical materials, first-aid kits, and hormone-based products together represent 79.80% of the total U.S. pharmaceutical import value.
India is the top source of U.S. pharmaceutical imports by country in 2025, supplying US$13.39 billion or 18.44% of quantity share, verified by TradeInt U.S. Customs import data. India is followed by Germany, Belgium, China, and South Korea among the leading partners.
From TradeInt's verified shipment records, the top 5 sources are India (US$13.39 billion), Germany (US$7.83 billion), Belgium (US$5.14 billion), China (US$4.38 billion), and South Korea (US$3.55 billion), together accounting for 47.21% of the total U.S. pharmaceutical import value in 2025.
In 2025, the top 5 countries supplying pharmaceuticals to the U.S. are India, Germany, Belgium, China, and South Korea. India leads in value at US$13.39 billion, while China carries the largest shipment volume at 18.06%.
More than 50 countries export pharmaceuticals to the U.S., with India, Germany, Belgium, China, South Korea, Italy, France, the Dominican Republic, the Netherlands, and Guatemala leading.
TradeInt covers verified shipment records across 200+ countries for full visibility. Book a free demo to learn more.
Top importers of rice in USA Q1 2026 are: DAESANG AMERICA (16.04%), MAPEI CARIBE (11.03%) lead. South Korea, Thailand, India anchor origins. TradeInt analysis.
TradeInt Malaysia import data for Q1 2026: integrated circuits led at US$22.19B, refined petroleum US$5.63B, with China the largest source.
TradeInt trade data: Importers of garments in USA Q1 2026 led by EFL CONTAINER LINES, IMPERATIVE LOGISTICS and GILDAN; China and Vietnam top origins.
US imports by country Q1 2026: Mexico US$138.03B, Canada US$91.59B, Taiwan US$67.42B lead. China dropped to #4. Full breakdown with HS codes on TradeInt.
Where does Japan oil import from in 2026? The US leads in recorded crude imports at US$2.00 billion, ahead of Mexico at US$0.27 billion under HS 2709.
Where does Indonesia import oil from in 2026? Nigeria leads recorded crude at US$1.46 billion, ahead of Angola at US$856.21 million under HS 2709.