Malaysia import data in Q1 2026: What are the highlights?
- Electronic integrated circuits (HS 8542) are the main import of Malaysia at US$22.19 billion (24.22% share) in Q1 2026, ahead of refined petroleum at US$5.63 billion (6.15%), based on TradeInt's records.
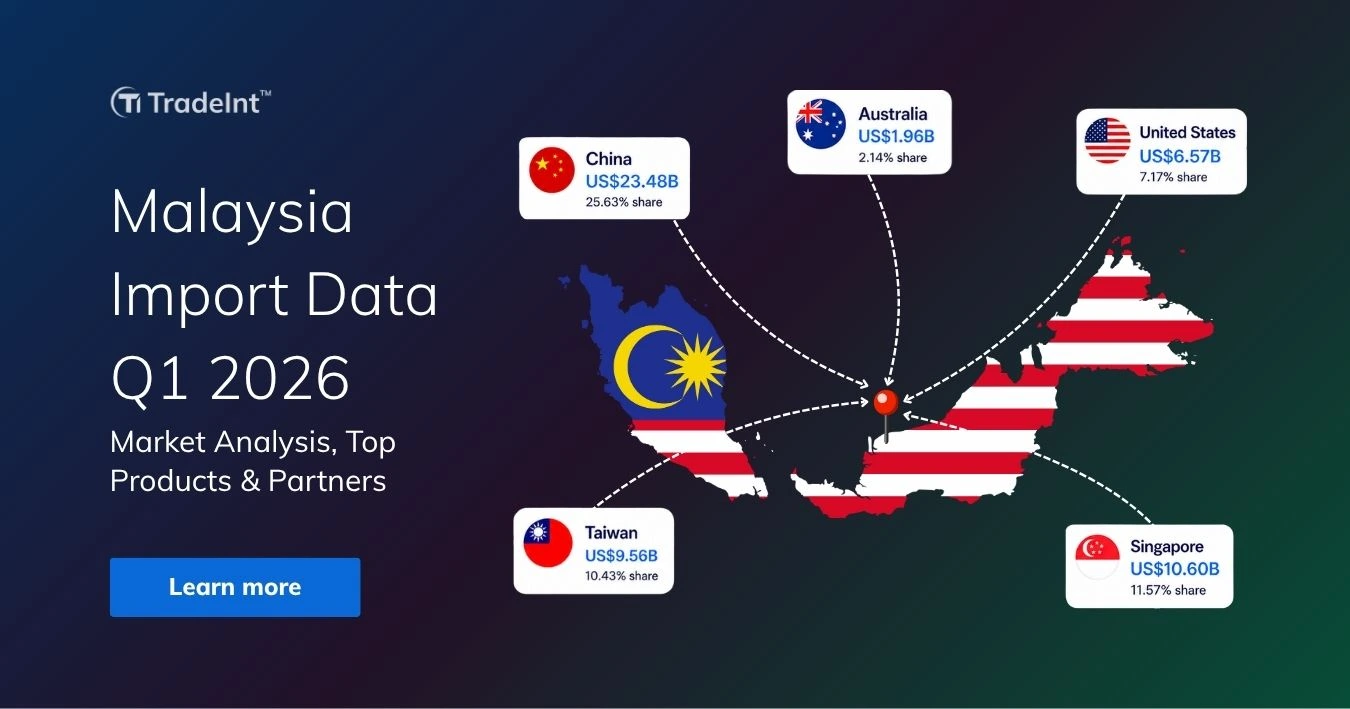
- China is the largest importer to Malaysia at US$23.48 billion (25.63%), followed by Singapore at US$10.60 billion (11.57%) and Taiwan at US$9.56 billion (10.43%).
- Malaysia's import basket mixes intermediate factory inputs, energy, and reserves buying, with crude petroleum, gold, smartphones, and semiconductor machinery all in the top ten.
- Department of Statistics Malaysia reported Malaysia's imports grew 14.1% year-on-year to RM143.6 billion (~US$35.0B) in May 2026, led by intermediate goods feeding the export sector.
Malaysia import product list: What are the main imports of Malaysia?
The main imports of Malaysia are electronic integrated circuits (HS 8542) at US$22.19 billion, refined petroleum oils (HS 2710) at US$5.63 billion, and automatic data processing machines (HS 8471) at US$3.04 billion, based on TradeInt's records.
Furthermore, smartphones, computer parts, crude petroleum, gold, semiconductor devices, semiconductor-making machinery, and gas turbines complete the top of Malaysia's import products list.
Top 5 main imports of Malaysia in Q1 2026:
- Electronic integrated circuits (HS 8542): the single largest import, feeding chip assembly and testing plants run by buyers such as Intel.
- Refined petroleum oils (HS 2710): the leading energy import, distributed through fuel traders, including Shell Malaysia Trading.
- Automatic data processing machines (HS 8471): servers and computers, with technology buyers such as ByteDance among the importers.
- Crude petroleum (HS 2709): refinery feedstock, drawn in by the Pengerang Refining Company.
- Gold (HS 7108): a reserves and investment line, handled by refiners such as MKS Pamp Malaysia.
 ✔ Malaysia Import Trade Data
💾 Search Malaysia Integrated Circuit Import Export Records on TradeInt
Browse transaction-date Bill of Lading entries for Malaysia's largest import, electronic integrated circuits (HS 8542), with past supplier names and shipments on TradeInt's global trade database.
Access here: Verified historical Malaysia HS 8542 import shipment records
Malaysia brings in chips and wafers, packages and tests them, then re-exports the finished product. That is why the same product line tops both sides of its trade.
According to The Malaysian Reserve citing DOSM, Malaysia's electrical and electronics manufacturing expanded 15.6% year-on-year in early 2026 on sustained global semiconductor demand, which directly lifts the chip and component imports that feed those plants.
- Chips track the AI build-out: Rising global demand for AI and data-centre hardware is drawing more chips into Malaysia's assembly and testing plants. DOSM linked this same demand to the country's record electronics exports in May 2026.
- Crude oil buying eased: Malaysia's crude oil import volume fell 41.3% year-on-year in May 2026, even as average prices rose 63.4%, according to DOSM. This points to refiners scaling back feedstock purchases as margins come under pressure.
- Gold follows a separate cycle: Gold's position among Malaysia's top imports reflects global demand for safe-haven assets, a flow that moves independently of the country's electronics and energy trade.
Malaysia imports by country: Who are the largest importers of Malaysia?
China is the largest importer to Malaysia at US$23.48 billion, followed by Singapore at US$10.60 billion and Taiwan at US$9.56 billion in Q1 2026, according to TradeInt's Malaysia Import Data and Bill of Lading database.
The United States, South Korea, Japan, Indonesia, Thailand, Vietnam, and Australia complete the top ten source countries supplying Malaysia, from TradeInt's records.
Top 5 importers of Malaysia in Q1 2026:
- China (US$23.48 billion): the top source overall, supplying integrated circuits through Micron Semiconductor Xian.
- Singapore (US$10.60 billion): the leading regional gateway, with Micron Semi Asia Ops a top supplier.
- Taiwan (US$9.56 billion): an upstream chip source feeding Malaysia's assembly stage.
- United States (US$6.57 billion): a chip and equipment source led by Intel Corporation.
- Australia (US$1.96 billion): an energy source, supplying petroleum gases through GLNG Operations.
✔ Lite ✔ Pro ✔ Premium ✔ Enterprise
🥬 Malaysia Trade Data 2025 Insights by TradeInt
Malaysia's 2025 external trade hit $646.3 billion (RM3.061 trillion), crossing RM3T for the first time, up 6.3% year-over-year. Exports of $338.4 billion beat imports of $307.9 billion. The milestone signals a structurally larger trade economy, with trade-to-GDP among ASEAN's highest, rivaling Belgium's GDP scale.
Read more: Malaysia Trade Data 2025 | Malaysia Import Export Statistics
From Malay Mail citing DOSM, China drove the single largest share of Malaysia's May 2026 import rise at RM11.3 billion, well ahead of Singapore (RM5.6 billion) and Taiwan (RM3.7 billion), the same top three seen in the quarterly partner table.
The same release notes that geopolitical tensions in West Asia weighed on some consumer-goods imports, a reminder that partner concentration leaves the basket exposed to regional shocks beyond Asia.
Here are some worth-noting highlights of Malaysia's export partners:
- China sells more than chips: DOSM reported that Malaysia's chemical imports from China rose 66.5%, and machinery and parts imports rose 23.7% in May 2026. This shows China's role goes beyond electronics into Malaysia's broader industrial input base.
- North Asia supplies the upstream components: Taiwan, South Korea, and Japan supply the wafers, memory, and precision parts that feed Malaysia's chip assembly stage. This is why all three rank in Malaysia's top six import partners, even though Malaysia exports finished chips back into the same region.
- Imported EVs face new requirements: Starting July 1, 2026, Malaysia requires fully imported electric vehicles to meet a minimum value and power threshold. Currently, China-built EVs keep a cost advantage under the ASEAN trade framework, which points to a shift in where Malaysia sources its imported cars.
How is the import market for Malaysia in 2026?
Malaysia's tracked import value moved through a full cycle across 2025 before easing into early 2026, according to TradeInt's trade trends analysis. Malaysia's quarterly import value peaked in Q2 2025 at US$170.51 billion, a 12.50% quarter-on-quarter gain, then stepped down to US$125.03 billion in Q4 2025 and US$91.61 billion in Q1 2026.
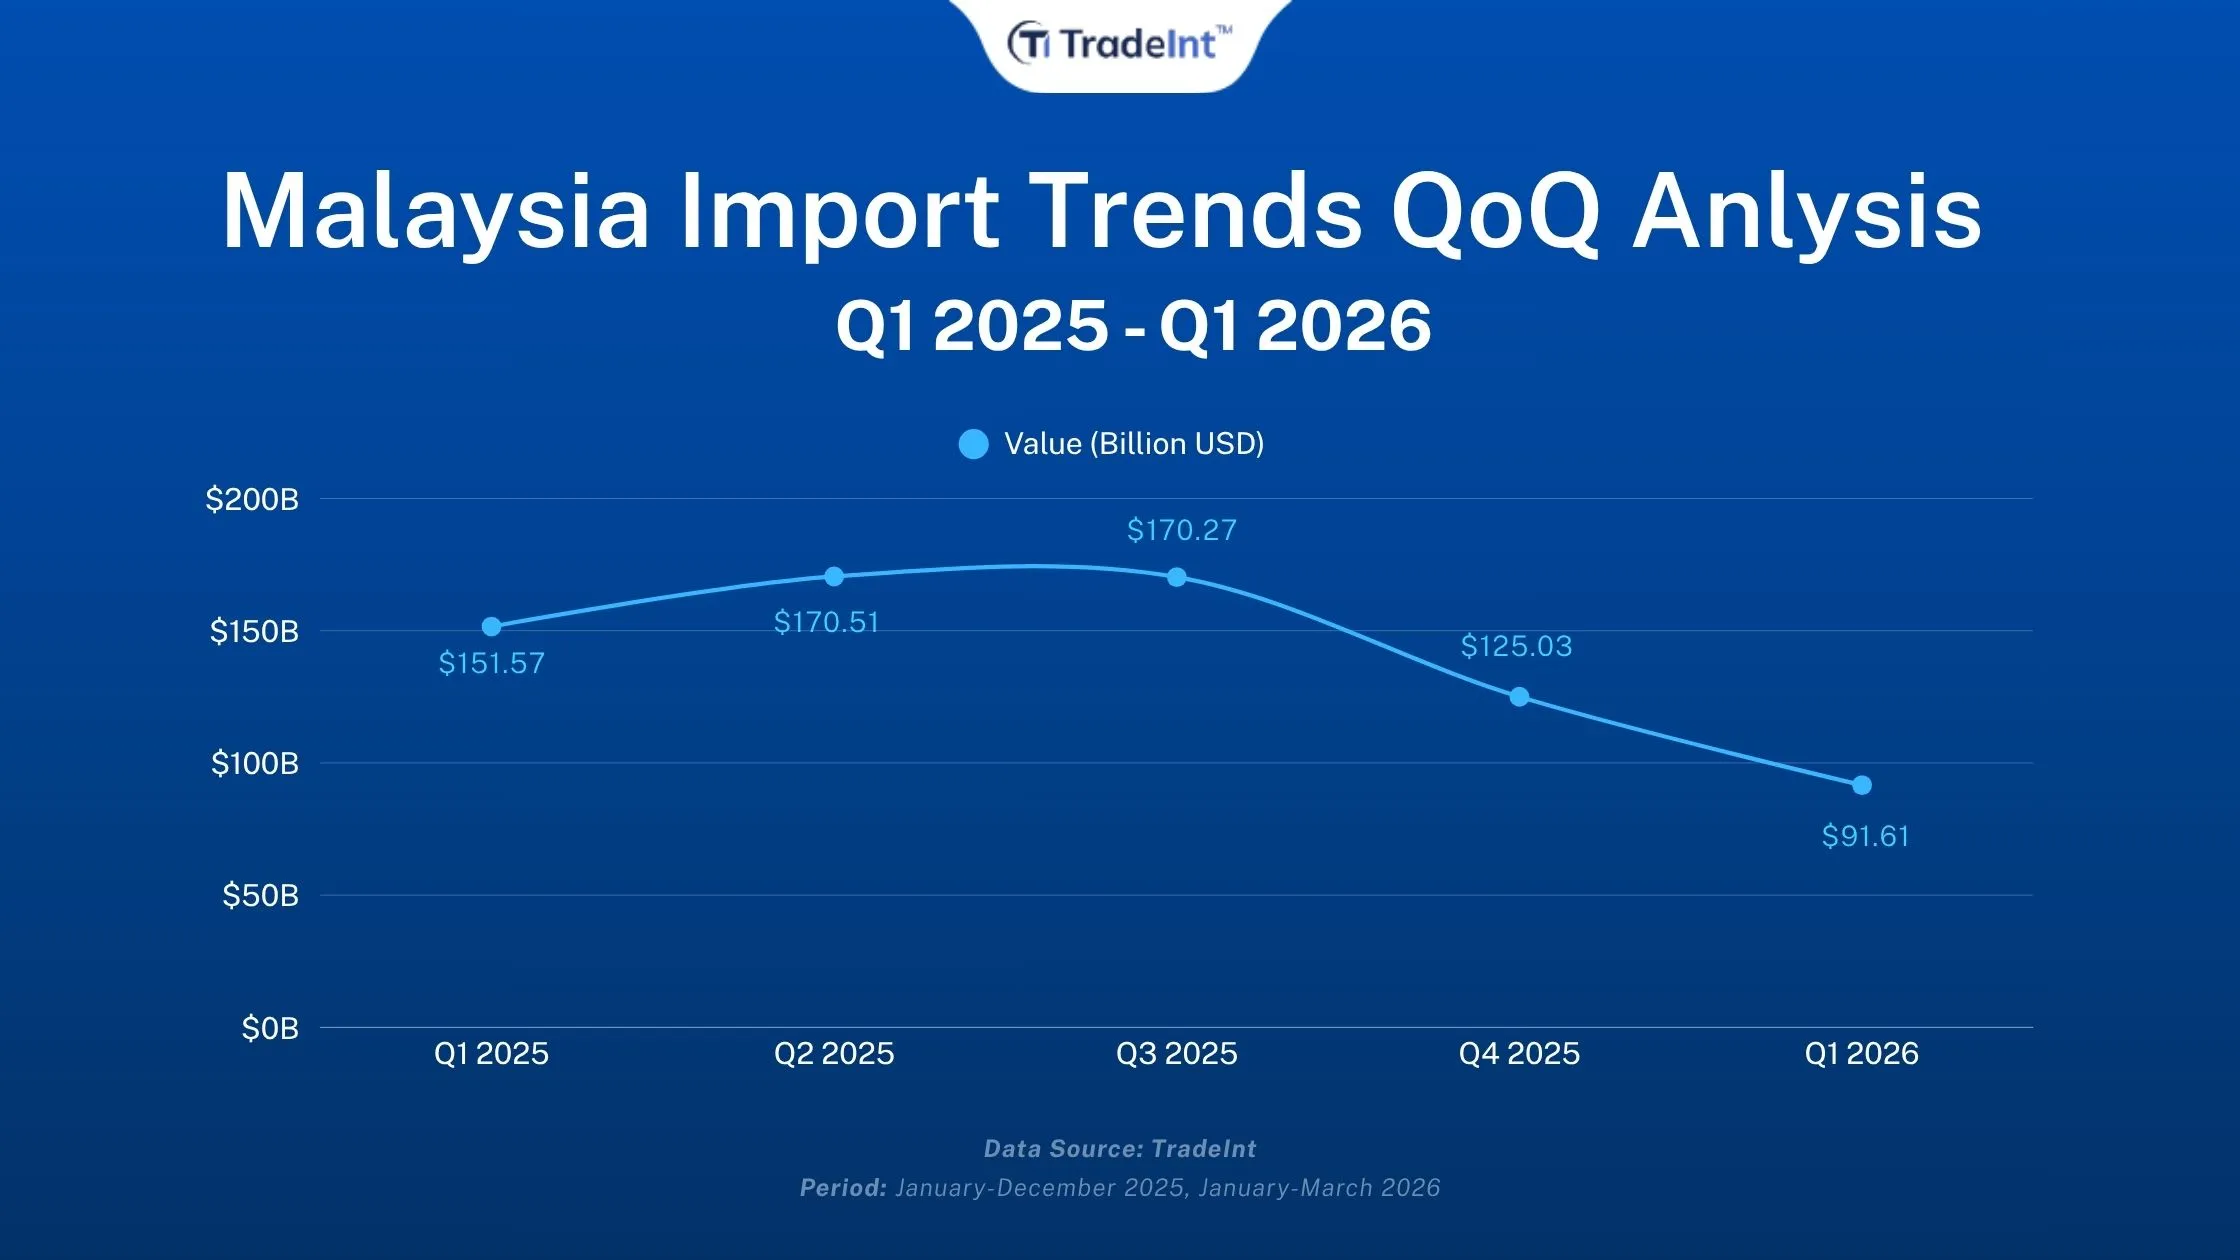
Observation: Malaysia's total import value increased to the highest in Q3 2025, then slowly dropped to Q1 2026
According to the Department of Statistics Malaysia's April 2026 release (DOSM), Malaysia's imports rose 20.0% year-on-year to RM154.0 billion (~US$37.6B) in April 2026, and the May 2026 release showed imports up 14.1% to RM143.6 billion (~US$35.0B). What stands out is the split by end use.
Reading Malaysia's 2026 import market through the official breakdown, three structural signals stand out:
- Factory inputs are rising while investment goods fall: DOSM's end-use breakdown for May 2026 shows intermediate goods climbing 14.4% year-on-year, while capital goods fell 18.3% and consumption goods slipped 2.7%, a pattern that points to factories running existing capacity hard rather than building new lines.
- Imports track the export cycle: DOSM reported that manufactured goods made up 87.8% of Malaysia's May 2026 imports at RM126.2 billion (~US$30.8B), confirming that the country imports chiefly to re-manufacture and re-export rather than to consume domestically.
- Energy value rose on price: DOSM noted Malaysia's refined petroleum import bill rose 40.8% in May 2026 on a 63.0% jump in average unit value, even as import volume fell 13.7%, so a higher fuel bill reflected global pricing rather than stronger demand.
At the state level, reporting from The Star shows Penang led Malaysia for both imports and exports in May 2026, the clearest sign that the country's import demand is concentrated where its semiconductor plants sit, as total trade reached RM327.6 billion (~US$79.9B).
✔ Lite ✔ Pro ✔ Premium ✔ Enterprise
📊 Track Malaysia's Import Value Shifts on TradeInt Trade Data Platform
Follow how Malaysia's inbound trade moved in the past with top HS codes, partners, and shipment records in TradeInt's Malaysia import overview.
Explore now: Malaysia import-export trade statistics overview by HS code and year
How to use Malaysia import data to identify export opportunities?
You can use Malaysia import data on TradeInt to find export opportunities by identifying which Malaysian companies regularly buy a given product, then approaching them directly as potential customers before your competitors do. TradeInt turns customs and shipment records into a targeted list of active buyers instead of a cold-outreach guessing game.
Here is a simple way to use TradeInt's Malaysia import data to find export opportunities:
- Start with your product or HS code: Search a category such as integrated circuits (HS 8542) or refined petroleum (HS 2710) on TradeInt to see every Malaysian company currently importing it.
- Filter by transaction date: Narrow records to a recent period to focus on active buyers rather than companies that imported once and stopped.
- Read the buyer and supplier fields: Each shipment on TradeInt names the Malaysian buyer and its current overseas supplier, showing you exactly who you'd be competing against.
- Check shipment frequency: Companies that import repeatedly signal steady, recurring demand, making them stronger prospects than a one-time buyer.
- Cross-check by competitor country: Filter by partner country to see which buyers already source from markets like China, Singapore, or Taiwan, and where there may be room to offer an alternative.
TradeInt's import-export database holds customs shipment records, company trade activity, and cross-border transaction history. Exporters can use it to identify active buyers, benchmark existing suppliers, and prioritize prospects by shipment volume and frequency.
For the full list of fields and coverage, see TradeInt's trade data availability.
Conclusion
Malaysia's import data for Q1 2026 shows a market built on electronics and energy. Electronic integrated circuits lead at US$22.19 billion, ahead of refined petroleum oils at US$5.63 billion and data processing machines at US$3.04 billion, according to TradeInt's Malaysia import data. China is the largest partner at US$23.48 billion, followed by Singapore and Taiwan.
The wider picture is one of solid annual growth and shifting product rules. DOSM's May 2026 figures show imports up 14.1% year-on-year, while new electric-vehicle rules and steady oil, gas, and food inflows reshape parts of the basket heading through 2026.
Book a demo with TradeInt to access Malaysia trade data in detail.
Frequently asked questions
What items are prohibited in customs in Malaysia?
Malaysia's customs authority restricts or prohibits goods such as illegal drugs, counterfeit items, and selected controlled products. These prohibition rules sit outside trade-data reporting and are set by Malaysian customs, so importers should check the official lists before shipping into the country.
Is Malaysia exporting more than importing?
Yes, Malaysia exports more than it imports and runs a steady trade surplus. According to DOSM, Malaysia's exports reached RM182.7 billion (~US$44.6B) against imports of RM154.0 billion (~US$37.6B) in April 2026, producing a trade surplus of RM28.8 billion (~US$7.0B).
What is the largest import item in Malaysia?
The largest import item in Malaysia is electronic integrated circuits (HS 8542), valued at US$22.19 billion and making up 24.22% of tracked imports in Q1 2026, based on TradeInt's records. These chips feed the country's semiconductor assembly and testing plants.
Where does Malaysia import rice from?
Malaysia imports rice mainly from regional Asian suppliers to top up domestic production. Rice sits within agricultural imports, which DOSM reported at 4.4% of Malaysia's total imports in May 2026, a far smaller share than its electronics and energy purchases.
Where does Malaysia import oil from?
Malaysia imports both crude and refined oil. Crude petroleum reached US$1.83 billion in Q1 2026, drawn in by refiners such as Pengerang Refining Company, while Australia supplies petroleum gases as a top energy line, based on TradeInt's records.