Snapshot of the global palm oil market
The global palm oil market reached nearly $73 billion in 2024 and is expected to grow at 5.3% annually through 2030. This growth comes from rising demand across food and beverages, biofuels, energy, personal care, and cosmetics industries.
The Asia Pacific region dominates the market with 71.18% of total revenue in 2024. This leadership position stems from the region’s rich supply of raw materials and favorable conditions for palm cultivation. The market remains highly competitive with many different players. Leading companies succeed by maintaining large production capacity, strong distribution networks, high product quality, and the ability to adapt their strategies quickly. These factors help them stay ahead in a fast-moving market where consumer needs and regulations constantly change.

TradeInt is a global trade data platform providing access to over 10 billion verified import and export records. Its coverage spans over 200 countries and more than 80 customs data sources.
This article provides a snapshot of Malaysia’s palm oil export products. Use TradeInt to explore more detailed trade records and continue tracking this market as new data becomes available. Search Malaysia palm oil export records →
Key palm oil product segments in Malaysia
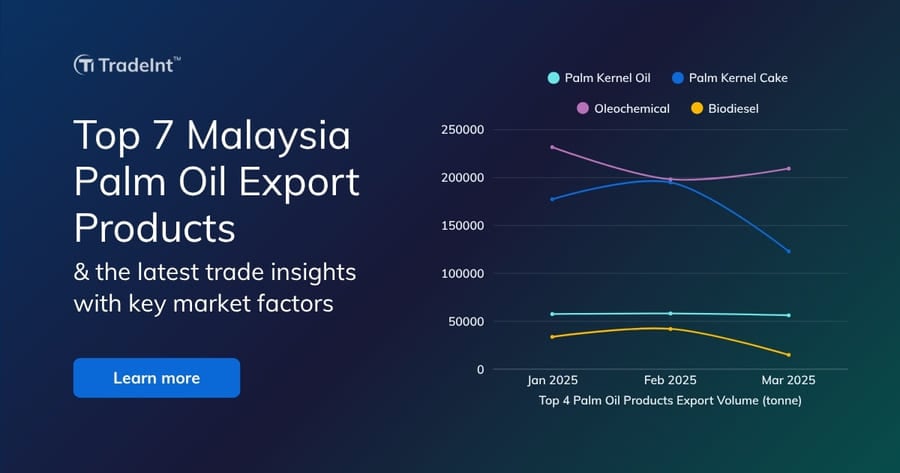
Malaysia’s palm oil exports comprise several key product segments, which reflect the diversity of palm oil derivatives and processed products. In this article, we will talk about the top 7 palm oil export products, including crude palm oil, palm kernel, palm kernel cake, oleochemicals, biodiesel, used cooking oil, and finished palm oil products.
Top 1 Palm Oil Export Products: Crude Palm Oil (CPO)
CPO is one of Malaysia’s most prominent export products and forms a cornerstone of the country’s economy and export portfolio. It is the unrefined oil extracted from the fruit of the oil palm tree.
The early months of 2025 revealed considerable volatility in this sector, with export volume plummeting to 0.129 million tonnes in March. This dramatic drop likely stemmed from seasonal factors and weather-related challenges that commonly affect palm oil cultivation. Nonetheless, as production recovers, in April 2025, Malaysia’s CPO production surged by nearly 70% compared to March, reaching 0.188 million tonnes.
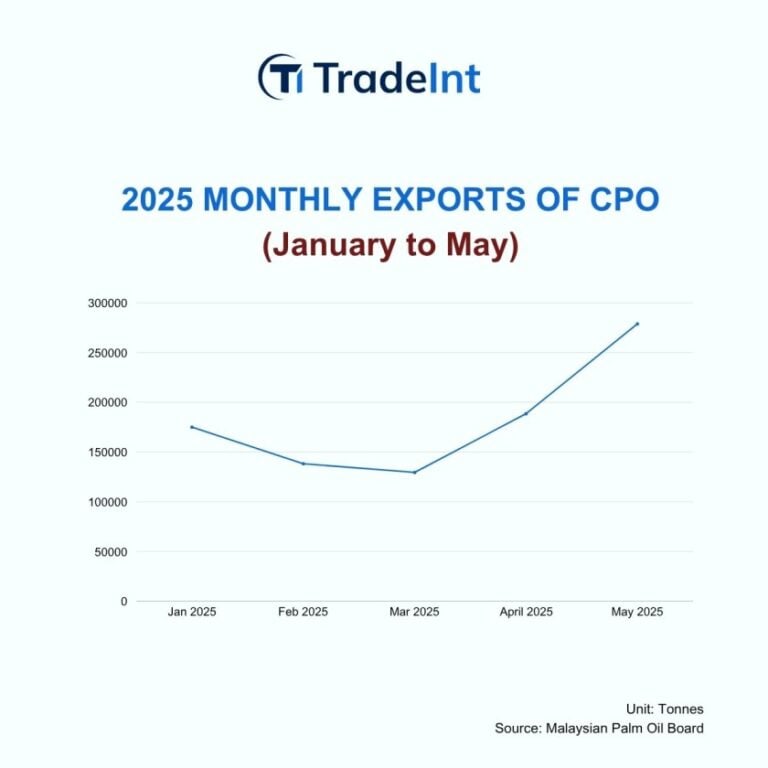
Image Caption: Line chart showing Malaysia's monthly crude palm oil (CPO) exports from January to May 2024, with a sharp increase in April and peaking in May
The sharp fluctuations in export volumes in the first five months of 2025 reflected the volatile nature of crude palm oil exports, a sector that is highly prone to seasonal shifts in demand and intense competition with other leading exporters.
Take a look at who the key players are directly competing with Malaysia in this landscape and compare which product lines are most actively traded in these countries.
Top 10 Crude Palm Oil Exporting Countries & Top 3 Transacted HS Codes in 2025
For traders, manufacturers, and supply chain analysts, staying updated with real export records is key to identifying active buyers, tracking shipment volumes, and assessing short-term trade sentiment.
You may want to read more: Top 10 Crude Oil Exporting Countries in the World
Supply Chain analysts predict that CPO price will remain at about $932 per tonne at least until the third quarter due to continued recovery in outut from other major exporters, such as Indonesia and the other regional competitors of Malaysia.
Top 2 Palm Oil Export Products: Palm Kernel Oil (PKO)
Palm kernel oil (PKO), derived from the kernel of the oil palm fruit, is another significant export product of Malaysia. The country holds approximately 31% of PKO exports, second only to Indonesia, which controls 48%. Key export destinations for Malaysian PKO include EU countries and major economies in Asia-Pacific such as China, India, and Japan.
Top 10 Export Destinations of Malaysia Palm Kernel Oil (2023)
Source: Department of Statistics, Malaysia (DOSM)
The 2023 distribution of import markets revealed Malaysia’s broad trade reach in the PKO segment, with destinations spanning both developed and developing economies across multiple continents. But two years on, how has the global PKO import landscape evolved? The table below highlights today’s most active buyers and favored product segments, thus revealing key opportunities for Malaysia in the coming months to maximize profitability.
Top 10 Palm Kernel Oil Importing Countries & Top 3 Transacted HS Codes in 2025
Are you an overseas palm kernel oil supplier planning to also export PKO to these major markets and in need of a list of trustworthy import partners despite having strong competition with Malaysia’s supplier?
In early 2025, Malaysia experienced significant fluctuations in its PKO exports. January saw a sharp decline of 41%, equalling 56,700 tonnes, mainly due to lower production. However, the sector demonstrated strong recovery by April 2025, with exports rebounding significantly by 77% year-on-year to 99,691 tonnes, up from 56,315 tonnes in February, according to the Malaysian Palm Oil Board (MPOB).
Top 3 Palm Oil Export Products: Palm Kernel Cake (PKC)
Palm kernel cake (PKC) is a by-product of palm kernel oil (PKO) extraction. Used primarily as animal feed, PKC is a vital commodity in the global livestock industry. Despite fluctuations in the production of PKO and crude palm oil, PKC exports have remained relatively stable, showing resilience compared to other palm oil products.
In early 2025, Malaysia’s PKC exports experienced slight fluctuations, with a minor dip in January 2025, followed by a strong recovery in April 2025. In April, exports surged by 14.5% to 140,833 tonnes, rebounding from 122,977 tonnes in March. This growth was supported by a rise in production, which increased by 11.7% in April to 192,857 tonnes.
Malaysia is a key global supplier of palm kernel cake, with major export destinations being countries with large livestock industries. The product’s market is sensitive to global demand for feed ingredients, as well as the competitiveness of PKC against alternative feedstocks.
Top 5 Biggest Importers of Malaysia's PKC in 2023
Shortly, it is expected that PKC will continue to be a stable and essential segment of Malaysia’s palm oil exports by benefiting from a consistent demand in the global animal husbandry market. This is supported by Malaysia’s 2024 PKC export volume, which exceeded 2.4 million tonnes, with major buyers such as South Korea, New Zealand, and the EU relying on it as a cost-effective, high-fiber feed component in livestock nutrition.
Among all feedstock options, including soybean and bran, PKC and other vegetable residues represented by the HS Code 2306 account for the largest share.
For a broader perspective on Malaysia’s 2306 product export performance, click here to view more relevant 2306 trade records and trade export overview charts
Top 4 Palm Oil Export Products: Oleochemicals
Oleochemicals, derived from palm oil and palm kernel oil, represent a significant and growing segment of Malaysia’s palm oil exports. These products are essential in a wide range of industries, including personal care, pharmaceuticals, detergents, and cosmetics.
Oleochemicals have several HS codes depending on the specific product. Common HS codes include 38231200 for oleic acid, 38231100 for stearic acid, and 38231900 for other industrial monocarboxylic fatty acids. Additionally, certain palm oil fractions may fall under 1511, and other oleochemicals can be found under 382499 or 291570.
With overlapping categories and product-specific variations, identifying the correct HS code can be time-consuming and prone to error.
Use TradeInt’s Global HS Code Search Tool to pinpoint the code associated with the product variation/segment you are looking for
In 2023, the Malaysian oleochemical market generated approximately USD 1.29 billion in revenue, and it is expected to grow at a compound annual growth rate (CAGR) of 7-8%, reaching an estimated USD 2.23 billion by 2030. This growth is driven by the rising demand for sustainable and bio-based chemicals in consumer goods, pharmaceuticals, and industrial applications.
While the oleochemical sector experienced some fluctuations in export performance, it remains a vital part of Malaysia’s chemical products sector. In January 2025, exports of oleochemicals were valued at RM5.51 billion (~USD 1.2 billion), representing about 4.5% of Malaysia’s total exports. Despite a slight decline in early 2025, the sector saw strong growth in several months, particularly with increased shipments to markets like the United Kingdom and New Zealand.
Key export destinations for Malaysian oleochemicals include the European Union, where demand is driven by sustainability standards, and markets such as the United Kingdom, New Zealand, and other global regions seeking bio-based chemicals. The sector benefits from Malaysia’s well-established infrastructure and regulatory support for renewable, biodegradable chemicals.
Top 5 Palm Oil Export Products: Biodiesel
Biodiesel, made primarily from palm oil, is an increasingly important segment of Malaysia’s palm oil exports, supported by growing global demand for renewable energy sources and national mandates aimed at reducing greenhouse gas emissions.
As of early 2025, Malaysia’s biodiesel export sector saw significant growth, with a 24.43% increase in exports in February 2025 compared to previous months. This upward trend reflects the rising importance of palm oil-based biodiesel in the global energy market
Biodiesel production in Malaysia is primarily driven by the government’s blending mandates, including the B10 (10% biodiesel blend) and the planned B20 (20% blend) mandates for the domestic market. The B20 mandate, which aims to reduce national greenhouse gas emissions, has faced delays, but when fully implemented, it is expected to increase biodiesel production to 1.3 million tonnes per year by 2025. While the domestic market is growing, exports remain a key part of the sector’s future, particularly to markets in Latin America and the United States.
Want to connect with quality suppliers that remain active in exporting Malaysia’s biodiesel to Latin American countries?
You may check this out: TradeInt’s Global Trade Records Search Tool here
The government’s efforts to expand biodiesel production and consumption are crucial for Malaysia’s long-term market positioning. While challenges such as infrastructure limitations and pricing dynamics remain, Malaysia’s ability to balance domestic and international demand for biodiesel will be key to its continued growth in this sector.
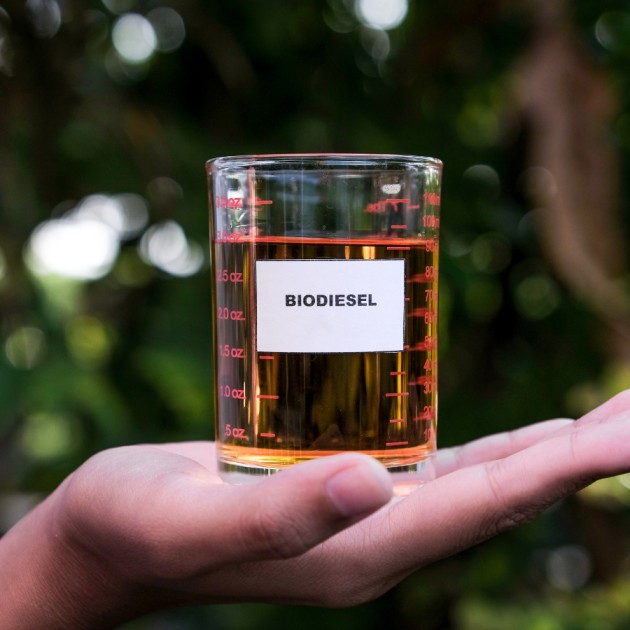
Image Caption: Palm-oil based bio diesel in a clear measuring glass. One of Malaysia's fastest-growing export products in 2025 driven by renewable energy demand.
Top 6 Palm Oil Export Products: Used Cooking Oil
Among Malaysia’s palm oil-linked export products, used cooking oil (UCO) has emerged as one of the fastest-growing segments – both in volume and strategic importance.
Data from Bursa Malaysia showed that in 2023, Malaysia exported 848,633 metric tons of UCO – an increase of 12% compared to 760,575 metric tons in 2022. This surge is being driven by rising global demand for renewable fuels, where UCO is increasingly used as a key feedstock.
While Europe remained the largest importer, with a volume of 543,985 metric tons, this figure marked a slight decline from the previous year (576,040 mt). However, this drop was offset by soaring demand from the Asia Oceania region, especially Singapore, which imported 293,838 metric tons, up significantly from 184,535 metric tons in 2022. Much of this supply supported Finland-originated Neste’s biofuel refinery in Tuas, which highlighted the strategic role of Singapore as a regional hub for renewable energy production.
Another notable development is Malaysia’s entry into the U.S. market, with exports reaching 7,810 metric tons in 2023 – compared to zero the year before. This sharp increase showed Malaysia’s rapid rise to its position as one of the world’s credible and sustainable inputs for green energy production.
The potential for growth in this product segment remains large, as a 2022 paper by the International Council on Clean Transportation pointed out that Malaysia had only harnessed 30-45% of its potential UCO collection.
UCO Potential vs. Collection – Asia Exporters (2022)
Comparing Estimates of UCO Potential and UCO Collection Among Six Asian Countries Exporting the Most UCO to Europe and the United States in 2022
(Unit: kilotonnes per year)
Malaysia’s used cooking oil (UCO) export market has become highly attractive due to strong demand from the EU and the US, where UCO is valued as a sustainable biofuel feedstock. However, the high market value has also led to widespread fraud, with virgin palm oil being mislabeled as UCO to access subsidies and preferential treatment. In response, the Malaysian Palm Oil Board (MPOB) implemented tighter regulations, including stricter audits, full supply chain traceability, and enhanced certification standards.
Therefore, for businesses, regulatory compliance is now essential. Success in this maturing market depends on sourcing from certified suppliers, maintaining full documentation, and staying informed about international regulations.
From Singapore to the U.S., businesses have been tracking how Malaysia Fuels Global Used Cooking Oil Supply Chains.
Book a demo to reveal global supply chain relationship mapping
Top 7 Palm Oil Export Products: Finished Palm Oil
Finished palm oil products include soaps, shortening, vanaspati, margarine, and specialty fats.
Data from the MPOB showed that roughly 530,000 tonnes of finished palm oil products were exported in 2023, which marked a slight decrease of over 6% compared to 2022’s figure. This segment, while smaller compared to crude palm oil and palm kernel oil exports, represents a significant niche within Malaysia’s palm oil export market that meets the global demand for value-added palm oil derivatives.
Export Volume of Palm Oil & Palm-Based Products 2023
| Category / Market | Share |
|---|---|
| Palm Oil | 61.9% |
| PK Oil | 10% |
| PK Cake | 9% |
| Oleo | 5% |
| Bio Diesel | 2.2% |
| Others | 8% |
| FP | 4% |
Data Source: Malaysia Palm Oil Industry Performance
Visualised by TradeInt
These products are in demand across various regions, with notable markets including India, China, Kenya, and several European countries. Malaysia’s strategy to expand its range of value-added products has helped capture higher margins, reduce reliance on crude palm oil exports, and strengthen its position in competitive markets.
Key Influences on Malaysia's Palm Oil Exports
In the first few months of 2025, Malaysia’s palm oil export volume experienced a noticeable decline. In January 2025, the volume fell by nearly 13% month-on-month 1.17 million metric tons. However, in April, Malaysia’s palm oil exports increased sharply by 24.6% month-on-month, which reflected an outstanding recovery after the earlier dip. Production also rose by 3.51% month-on-month in early May 2025. However, palm oil prices remained soft due to rising stockpiles and increased production.
- Factor #1: Seasonal decline in production
The early months of 2025 saw a seasonal drop in palm oil production due to the monsoon season and public holidays, resulting in a significant decrease in export volume.
- Factor #2: Malaysia’s vulnerability to environmental factors
Adverse weather conditions like flooding, combined with aging palm trees, led to reduced output, which have directly impacted the export volume. These disruptions, coupled with a seasonal dip in production, further strained the export pipeline.
- Factor #3: Fluctuating Demand
Malaysia’s palm oil exports to key markets like China and India faced notable declines in early 2025. In early 2025, Malaysia’s palm oil exports to China fell by 64% in the first half of March 2025 compared to February 2025, mainly consisting of palm acid oil and palm stearin used in oleochemicals and animal feed. In late 2024 and early 2025, there was also a slump in exports to India caused by high prices and increased domestic production, yet this figure saw a rebound in later months. The recovery is attributed to the fact that palm oil accounts for about 40% of the country’s total consumption of edible oil, according to ICRA Limited.
In addition, the European Union (EU), one of Malaysia’s top palm oil export destinations, has seen a consistent decline in demand. This trend is largely driven by new EU regulations that require proof of deforestation-free supply chains for palm oil imports. Between July 1 and December 10, 2024, the EU-27 imported just under 1.4 million tonnes of palm oil, which was a 16% decrease compared to the previous year. The EU’s commitment to sustainability and environmental standards, especially with its Deforestation-free Regulation (EUDR), is limiting market access for Malaysian palm oil. Moreover, the European Commission’s plans to phase out the use of palm oil in transport fuel by 2030 could further diminish the demand for Malaysian palm oil in the EU.
What is the outlook for Malaysia's palm oil export statistics?
Since April 2025, there has been a significant recovery in palm oil production, which was then mirrored in a 24.6% month-on-month increase in exports, according to the Malaysian Palm Oil Producers Association (MPOC).
In Malaysia’s major markets, demand is poised to recover as well. India’s import demand is expected to remain robust due to palm oil’s cost advantage over alternatives like soybean oil, with imports forecast to reach 700,000 tonnes monthly by mid-2025. Similarly, after Malaysia and China agreed on the establishment of a cross-border supply chain of palm oil, this market presents robust potential for growth.
However, prices are expected to remain low until the third quarter of 2024, mostly due to the abundance of supply. Potential disruptions from weather events such as the anticipated El Niño in 2027 signal another risk.
Looking ahead, the EU Deforestation Regulation (EUDR) is set to take effect in December 2025, presenting challenges and opportunities for certified producers who meet sustainability criteria.
“The Malaysian palm oil companies and smallholders have made significant strides to reduce primary forest loss and forest degradation… The European Commission knows that we have a far better record on this than some European states. And yet the European Commission has rewarded its own members with ‘low risk’ status. This apparent favoritism will inevitably cause resentment instead of building bridges for closer cooperation.”
– Dato’ Carl Bek-Nielsen, Chairman at Malaysian Palm Oil Council
The Malaysian government has introduced the Malaysian Sustainable Palm Oil (MSPO) certification and made it an obligation for all Malaysian palm oil plantations and mills in 2019, with a view to certifying 95% of its palm oil planted area by mid-2025.
This certification is recognized internationally and has been extremely helpful in enabling Malaysian palm oil to meet increasing global sustainability demands, including regulations from the EU. Therefore, it improves the competitiveness of Malaysian palm oil across global markets.
All in all, Malaysian palm oil exports are likely to experience a steady growth pace thanks to recovering production capacity and stable demand from key markets. Most importantly, the government’s initiatives, which prioritize modernization and value-added products, help put the country in a favorable position to enjoy greater competitiveness and capture higher margins.
Conclusion
With a stable supply and a huge variety of products (both crude and refined), Malaysia is a significant exporter of palm oil and, thus, plays a key role in facilitating the development of different major consumer industries across the world. However, this landscape is also highly prone to environmental factors, seasonal fluctuations, and impact from the introduction of new sustainability-focused policies.
To navigate such a volatile sector, the need for data-driven decision-making and planning is a top priority for businesses. With TradeInt, they have access to a powerful trade intelligence platform that entails the latest statistics across different product segments, with detailed reports on palm oil trade flows in both traditional and emerging buyers of Malaysia.