Tuna fish export: What are the tuna fish export market trend highlights in 2026?
- Kazakhstan tops TradeInt's tracked HS 0302, 0303, and 0304 fish and fillet export table at US$13.08 billion (54.25% share) in H1 2026.
- Vietnam's tuna-specific export value reached US$544 million over the first seven months of 2026 (up 2% year-on-year), with July alone hitting close to US$90 million on a 30% jump.
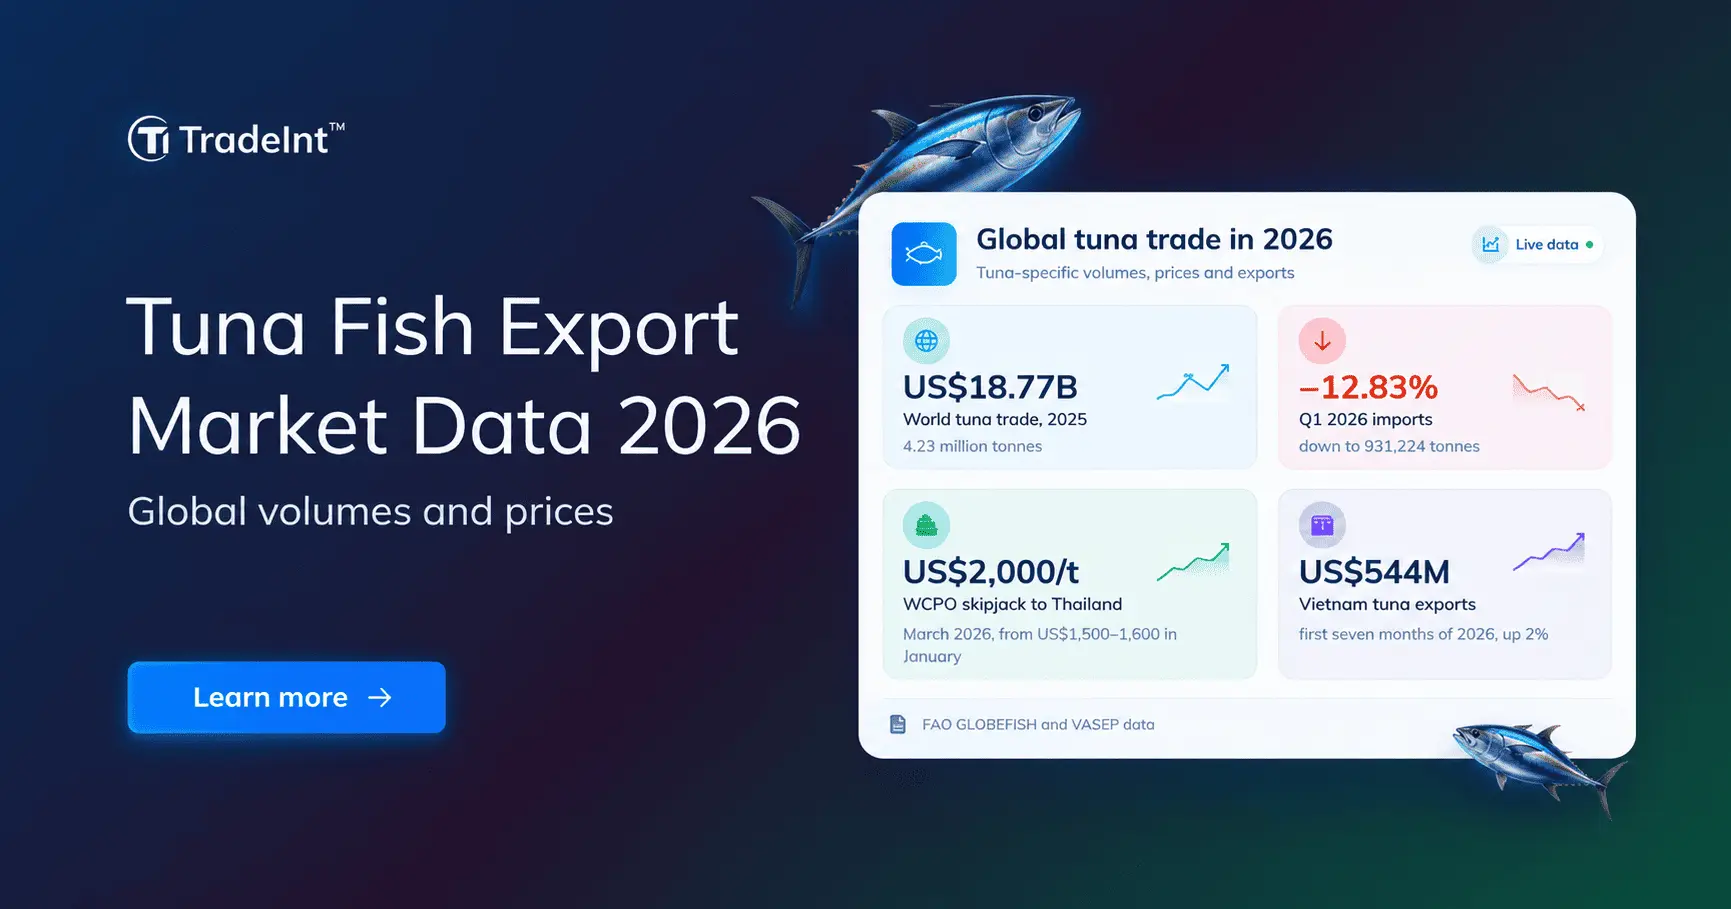
- Global tuna trade was 4.23 million tonnes valued at US$18.77 billion in 2025, but Q1 2026 imports fell 12.83% year-on-year to 931,224 tonnes.
Which country is the biggest exporter of tuna in 2026?
Based on TradeInt's global fish and fillet export data under HS 0302, 0303, and 0304 in H1 2026, Kazakhstan leads the tracked table at US$13.08 billion (54.25%) through TOO FISH PRODEX-routed shipments to EU trader hubs, followed by Chile at US$3.94 billion, where EMPRESAS AQUACHILE's salmonid frozen-fillet book (HS 030441) carries most of the value.
Vietnam sits third at US$1.83 billion through CÔNG TY CP VĨNH HOÀN with Pangasius fillets (HS 030462) and tuna both in the mix, ahead of Indonesia at US$1.09 billion (BALI INDAH SAMUDERA fresh-fish exports) and the United States at US$878.65 million (PACIFIC SEAFOOD GROUP frozen fish).
Top 5 fish and fillet exporting countries in H1 2026 (HS 0302, 0303, 0304):
- Kazakhstan - US$13.08 billion (54.25%): the top tracked exporter, handled through TOO FISH PRODEX with EU trader-hub destinations reflecting transit and re-export activity.
- Chile - US$3.94 billion (16.32%): the leading salmonid exporter, anchored by EMPRESAS AQUACHILE's frozen Salmo salar fillets (HS 030441).
- Vietnam - US$1.83 billion (7.60%): the top Southeast Asian exporter, driven by CÔNG TY CP VĨNH HOÀN's Pangasius fillets alongside a growing tuna line.
- Indonesia - US$1.09 billion (4.54%): fresh-fish exports handled through BALI INDAH SAMUDERA to Xiamen and other Chinese buyers.
- United States - US$878.65 million (3.64%): frozen fish shipments consolidated through PACIFIC SEAFOOD GROUP.
Global tuna trade tightened materially in early 2026 after a broadly stable 2025. According to FAO GLOBEFISH, world tuna trade reached 4.23 million tonnes valued at US$18.77 billion in 2025, but Q1 2026 imports fell 12.83% year-on-year to 931,224 tonnes on weak catches and higher fuel costs.
Meanwhile, the mix shifted toward higher-value processed forms. Frozen tuna fillet imports rose 5.47% in 2025 while prepared and preserved tuna imports climbed 8.91%, confirming stronger demand for value-added and ready-to-eat products even as whole frozen tuna imports fell 8.3% to 2.19 million tonnes.
 ✔ Lite ✔ Pro ✔ Premium ✔ Enterprise
🔍 Global Fish and Fillet (HS 0302, 0303, 0304) Historical Import Records on TradeInt
Preview transaction-date fish and fillet import shipments across exporters, importer companies, and buyer countries.
Explore here: Global tuna import trade records search results
Top 1: Kazakhstan
Based on TradeInt's Kazakhstan export records under HS 0302, 0303, and 0304 in H1 2026, Kazakhstan's US$13.08 billion tracked value moves mainly to Denmark at US$4.81 billion (36.73%) through LL COLD APS BY ORDER KANGAMIUT SEAFOOD A S, followed by Lithuania at US$2.65 billion (20.28%) via UAB LETAKA. Netherlands sits third at US$2.35 billion (17.98%) through OLHOVOJ GMBH BY ORDER NORTON SELLS LTD, ahead of Germany at US$1.15 billion (8.78%) via NAGEL GROUP LOGISTICS and Poland at US$1.13 billion (8.66%) through UAB LETAKA channels.
Top 5 destinations of Kazakhstan tracked exports in H1 2026:
- Denmark - US$4.81 billion (36.73%): the top destination, handled through LL COLD APS on behalf of Greenlandic seafood group Kangamiut Seafood.
- Lithuania - US$2.65 billion (20.28%): trader-routed cargoes through UAB LETAKA, a Baltic-based fish trading company.
- Netherlands - US$2.35 billion (17.98%): trader-consolidated shipments handled by OLHOVOJ GMBH.
- Germany - US$1.15 billion (8.78%): logistics-driven flows via NAGEL GROUP LOGISTICS to German food-trade buyers.
- Poland - US$1.13 billion (8.66%): onward trader routing through UAB LETAKA into the Polish market.
Kazakhstan's #1 position reflects Caspian-linked transit and re-export activity through Kazakhstani customs channels rather than domestic ocean tuna production. Kazakhstan's only coastline is on the Caspian Sea, where the local fishery covers roach, sturgeon, and small pelagics-not tuna.
According to Undercurrent News, in July 2025 the FDA and New York State Department of Agriculture forced Krasniy Oktyabr Inc. to recall Aral-brand silver vobla (Caspian roach) marked "Product of Kazakhstan," confirming that genuine Kazakh fish exports are Caspian species at a much smaller scale than the US$13.08 billion tracked here.
Meanwhile, all top-five destinations are EU markets, and all top importers are trader-logistics groups (Kangamiut Seafood, UAB Letaka, Olhovoj GMBH, Nagel Group Logistics) rather than end-consumer buyers - a pattern consistent with re-export flows through Kazakhstani customs entry points.
✔ Lite ✔ Pro ✔ Premium ✔ Enterprise
📊 Fish and Fillet Trade Data Coverage on TradeInt
Review data fields, time ranges, and country coverage for HS 0302, 0303, and 0304 shipment records across 200+ countries.
Learn more: TradeInt's data availability for global trade data
Top 2: Chile
The United States leads Chile's destination table at US$1.38 billion (35.03%) through MULTI X S A F, followed by Japan at US$544.92 million (13.85%) with Salmones Aysen-supplied frozen coho and Salmo salar cargoes, powered by TradeInt's data in H1 2026.
Brazil holds 3rd at US$519.91 million (13.21%) via Multi X frozen premium salmon, ahead of China at US$190.62 million (4.84%) through PURE NATURE F and Côte d'Ivoire at US$120.05 million (3.05%) via FOODCORP CHILE.
Top 5 destinations of Chile fish and fillet exports in H1 2026:
- United States - US$1.38 billion (35.03%): frozen premium salmon shipments handled through MULTI X S A F for US retail and foodservice buyers.
- Japan - US$544.92 million (13.85%): frozen coho and salmo salar cargoes routed through Salmones Aysen with premium standard classification.
- Brazil - US$519.91 million (13.21%): Multi X-supplied frozen salmon fillets for the growing Brazilian premium seafood market.
- China - US$190.62 million (4.84%): trader-routed cargoes through PURE NATURE F for Chinese wholesale buyers.
- Cote D'Ivoire - US$120.05 million (3.05%): frozen cargoes shipped through FOODCORP CHILE to West African markets.
Chile's #2 position on the tracked table reflects salmon, not tuna. The country's top 4-digit HS code is 030441 (frozen Salmo salar fillets), and Empresas Aquachile - the world's second-largest salmon farming group by production - accounts for the largest supplier share.
As reported by Undercurrent News, Chilean salmon prices to Brazil dropped sharply in Q2 2026 on higher supply and weaker demand, a dynamic that helps explain the strong Brazilian destination volume in TradeInt's H1 2026 records.
Meanwhile, tuna represents a marginal share of Chile's total HS 0302, 0303, and 0304 export book. Chile does not operate a significant tuna fleet, so the country appears on the tuna export ranking only because HS 0302, 0303, and 0304 covers all fresh/frozen fish and fillet categories, not tuna specifically.
Observations on Chile's fish export market in 2026:
- Salmon dominates the export book: Salmo salar frozen fillets under HS 030441 concentrate over 60% of Chile's fish and fillet value on TradeInt's tracked records, with Empresas Aquachile as the top supplier.
- US and Brazil demand shifted through H1 2026: Chilean salmon prices to Brazil dropped sharply in Q2 2026 on higher supply and weaker demand, per Undercurrent News, which lifted volume shipments even as unit values eased.
- China's PURE NATURE F is a trader intermediary: The China channel at US$190.62 million reflects trader-routed cargoes rather than direct end-buyer purchases, a common Chinese import structure for premium salmon.
✔ Lite ✔ Pro ✔ Premium ✔ Enterprise
🇨🇱 Chile Trade Data Overview on TradeInt
Chile is the world's second-largest salmon producer, with HS 0302, 0303, and 0304 fish exports forming a major share of the trade summary.
Explore: Chile import export trade statistics overview by HS code and year
Top 3: Vietnam
Based on TradeInt's Vietnam export records under HS 0302, 0303, and 0304 in H1 2026, the United States leads Vietnam's destination table at US$285.33 million (15.57%) through COAST BEACON, followed by China at US$272.50 million (14.87%) via OCTOGONE GUANGDONG FOOD CO LTD.
Meanwhile, Brazil sits third at US$107.16 million (13.62%) through FRIGORIFICO JAHU LTDA, ahead of Japan at US$69.55 million (3.79%) via MATSUDA SANGYO CO LTD and Thailand at US$66.56 million (3.63%) through CP AXTRA PUBLIC COMPANY LIMITED.
Top 5 destinations of Vietnam fish and tuna exports in H1 2026:
- United States - US$285.33 million (15.57%): Coast Beacon-handled cargoes across Pangasius and tuna categories to US retail and foodservice.
- China - US$272.50 million (14.87%): Octogone Guangdong Food cross-border shipments for Chinese processing and retail.
- Brazil - US$107.16 million (13.62%): Frigorifico Jahu-received Vietnamese seafood serving the Brazilian food-processing sector.
- Japan - US$69.55 million (3.79%): Matsuda Sangyo-handled premium cargoes for Japanese fresh and frozen tuna buyers.
- Thailand - US$66.56 million (3.63%): CP Axtra Public Company received cargoes supplying Thai canning and retail chains.
Vietnam is the biggest true tuna-producing exporter in the tracked top 5. According to VOV reporting VASEP data, Vietnam's tuna-specific export revenue reached US$544 million over the first seven months of 2026, up 2% year-on-year, with July alone hitting close to US$90 million on a 30% jump.
Because the US recovered as the leading tuna destination, July tuna exports to the US alone reached US$37.6 million (up more than 80% year-on-year), lifting seven-month US turnover to US$213.6 million with a 39.3% share of Vietnamese tuna export value.
Meanwhile, Vietnam is expanding its position in regional tuna management. VOV reports Vietnam is pursuing full membership in the Western and Central Pacific Fisheries Commission (WCPFC), which the Ministry of Agriculture and Environment expects will strengthen Vietnam's seafood standing, expand export markets, and promote sustainable fisheries.
Patterns shaping Vietnam's tuna export picture in 2026:
- Four markets carry 82-86% of Vietnamese tuna exports: The US, EU, Middle East, and CPTPP member countries together account for 82% to 86% of Vietnam's total tuna export turnover, per VASEP, with Vietnamese tuna present in more than 100 markets.
- Tuna exports returned to growth in July after a soft first half: Seven-month 2026 turnover pulled back into positive territory at US$544 million (up 2% year-on-year) after a 2% decline in H1 2026, per VOV, on the strength of the July recovery.
- Vietnam is pursuing WCPFC full membership: According to VOV, Vietnam is working toward full membership in the Western and Central Pacific Fisheries Commission to strengthen its position in regional tuna management and market access.
✔ Lite ✔ Pro ✔ Premium ✔ Enterprise
🇮🇩 Indonesia Fish Export Data on TradeInt
Fresh or chilled fish (HS 030289) leads Indonesia's fish export at US$314.84 million, with China as the top destination at US$564.63 million.
Read more: Indonesia fish export data breakdown
Which countries import the most tuna for canning and processing?
Based on FAO GLOBEFISH's 2025 review, Thailand, Vietnam, and the Philippines lead global whole frozen tuna imports as the primary canning and processing hubs. Thailand alone imported 718,401 tonnes of whole frozen tuna in 2025 (down 17.18% year-on-year), remaining the world's largest tuna canning base even as raw-material supply tightened.
Global canned and preserved tuna trade reached 1.72 million tonnes valued at US$9.40 billion in 2025, per FAO, with processors in Thailand and Europe increasingly buying semi-processed cooked loins rather than whole frozen fish.
Highlights of the tuna import demand mix in 2026:
- Thailand's canning imports fell 17.18% in 2025 to 718,401 tonnes: The world's largest tuna canning base ran leaner on raw material even as canned tuna demand held up, per FAO GLOBEFISH.
- Prepared and preserved tuna imports grew 8.91% in 2025: Higher-value ready-to-eat tuna products outperformed whole frozen fish, reflecting a downstream shift toward processed forms.
- Vietnam is the biggest Southeast Asian tuna exporter: Vietnamese tuna exports reached US$544 million over 7-month 2026 with the US at 39.3% share, per VASEP.
Where to source tuna trade data and tuna buyer intelligence?
Sourcing tuna trade intelligence starts with matching the data type to the use case, because buyer discovery, supplier verification, price benchmarking, and market sizing each need different fields and time windows.
- Shipment-level trade records: TradeInt's Bill of Lading database holds 10B+ shipment records, and 500M+ verified business profiles across 200+ countries, letting buyers trace tuna consignments by HS code, exporter name, and destination.
- FAO GLOBEFISH species reports: the authoritative source for global tuna trade volumes, canning base activity, and processed-form breakdowns by market segment.
- VASEP (Vietnam Association of Seafood Exporters and Producers): country-specific tuna export data for Vietnam by destination, product form, and monthly cadence.
- Regional fisheries commissions: IATTC and WCPFC publish TAC decisions, catch quotas, and management framework updates that shape supply availability.
Conclusion
Tuna fish export in 2026 splits into two very different stories on TradeInt's tracked data. Kazakhstan tops the HS 0302, 0303, and 0304 aggregate at US$13.08 billion via Caspian-linked transit routing, Chile follows at US$3.94 billion on salmon rather than tuna, and Vietnam sits third at US$1.83 billion where the tuna-specific line contributed US$544 million over 7-month 2026 per VASEP.
Because global tuna trade volume fell 12.83% year-on-year in Q1 2026 while WCPO skipjack prices climbed to US$2,000/tonne, buyer competition will intensify against the Pacific bluefin 25% quota expansion for 2027-2028 and Vietnam's continuing seven-month growth to US$544 million per VASEP.
Speak with TradeInt to review HS 0302, 0303, and 0304 shipment records by exporter, destination market, and monthly period.
Frequently asked questions
Which country is the biggest exporter of tuna in the world?
By value under HS 0302, 0303, and 0304 in H1 2026, Kazakhstan tops TradeInt's tracked export table at US$13.08 billion (54.25% share), though this reflects Caspian-linked transit and re-export activity rather than domestic tuna production. Among true tuna-producing exporters, Vietnam leads the tracked Southeast Asian ranking with tuna-specific exports of US$544 million over the first seven months of 2026 per VASEP, ahead of Ecuador, Indonesia, and Thailand.
Where does tuna come from?
Most commercial tuna is caught in the Western and Central Pacific Ocean, which accounts for the majority of global skipjack (Katsuwonus pelamis) supply for canning. Ecuador, Indonesia, Papua New Guinea, the Philippines, and Vietnam are among the biggest tuna-fishing nations, while Thailand imports raw whole frozen tuna as the world's largest canning base at 718,401 tonnes in 2025.
What is the tuna fish export price in 2026?
Frozen skipjack tuna delivered from the Western and Central Pacific Ocean to Thailand rose from US$1,500-1,600 per tonne in January-February 2026 to US$2,000 per tonne in March 2026, a jump of 25% to 33% in two months on weak catches and higher fuel costs.
Which country consumes the most tuna?
Thailand imports the most raw whole frozen tuna at 718,401 tonnes in 2025, but as the world's largest tuna canning base, not for direct consumption. In terms of direct end-consumer demand, the United States, European Union, and Japan are the largest markets for canned and fresh tuna, respectively. Together with the Middle East and CPTPP member countries, these four regions account for 82% to 86% of Vietnamese tuna export turnover.