Pakistan import data: What the data reveal
- Energy is the single heaviest line in Pakistan's biggest imports, with mineral fuels at US$16.72 billion, more than the next two categories combined.
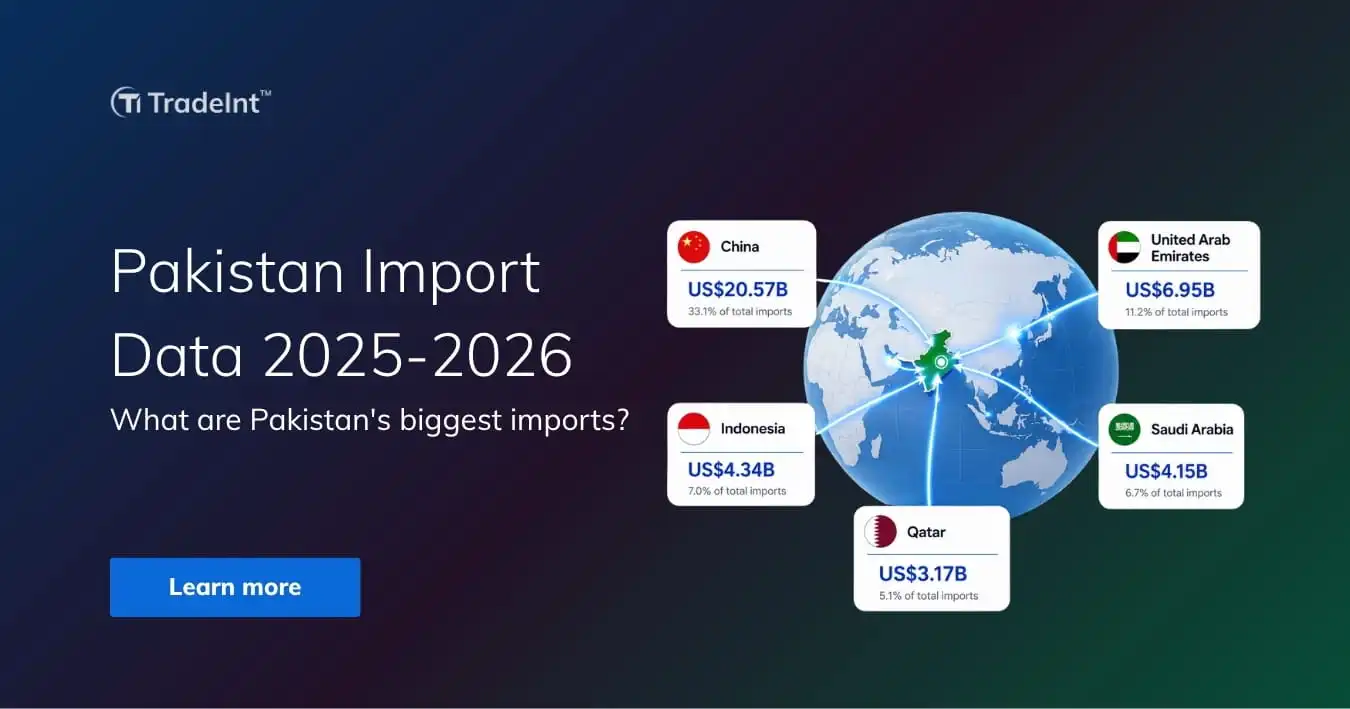
- China supplies far more than any other origin at US$20.57 billion, close to a third of all Pakistan's import goods by value.
- Machinery, vehicles and industrial inputs fill most of the top ten, so the basket reads as a production-and-energy list, with consumer goods a smaller share.
- In the fiscal year to June 2026, imports reached Rs19,594,926 million (about US$69,761 million), up 8.14% in dollar terms even as exports fell, on Pakistan Bureau of Statistics provisional figures.
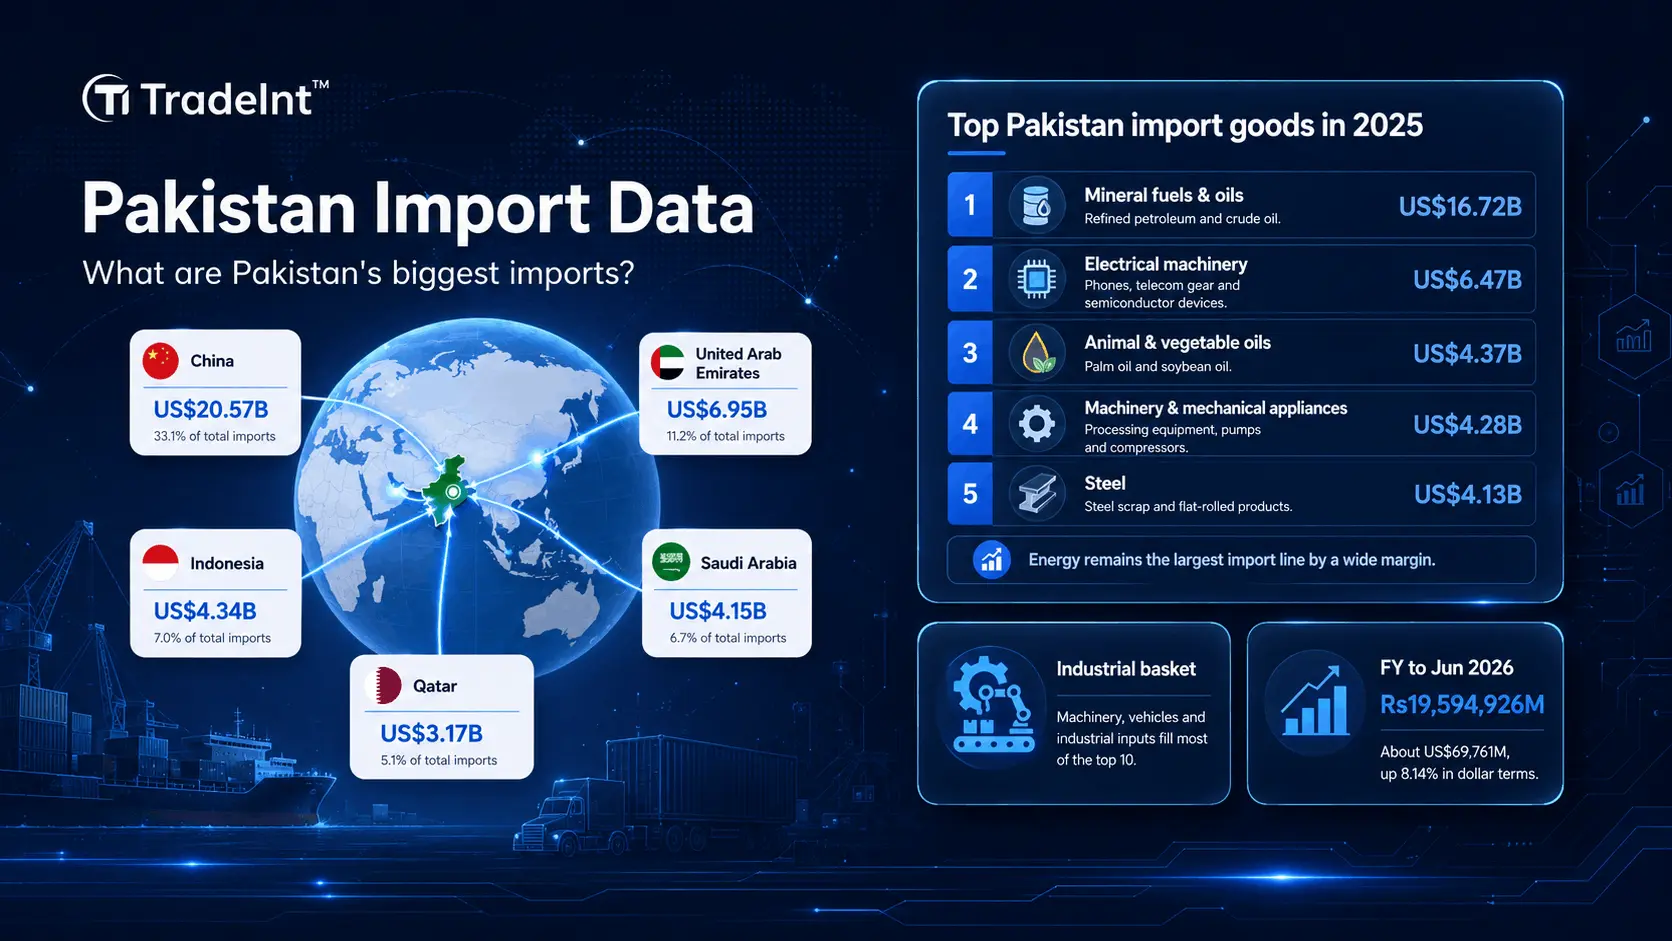
Pakistan import data 2025–2026: top import partners include China, UAE, Indonesia, Saudi Arabia, and Qatar.
What are Pakistan's biggest imports? Pakistan import data 2025
Based on TradeInt's Pakistan import records for the 2025 calendar year, the biggest import is mineral fuels at US$16.72 billion, followed by electrical machinery at US$6.47 billion and animal and vegetable oils at US$4.37 billion. The Pakistan import list by category from TradeInt also includes machinery, steel, vehicles, plastics, organic chemicals, cotton, and oilseeds.
Top 5 Pakistan import goods in 2025:
- Mineral fuels and oils (HS 2710, 2709) - US$16.72 billion: refined petroleum and crude oil, the largest line by a wide margin, sourced mainly from the United Arab Emirates.
- Electrical machinery and equipment (HS 8517, 8541) - US$6.47 billion: phones, telecom gear and semiconductor devices, led by China.
- Animal and vegetable oils (HS 1511, 1507) - US$4.37 billion: palm oil and soybean oil, with Indonesia the leading origin.
- Machinery and mechanical appliances (HS 8471, 8414) - US$4.28 billion: data processing equipment, pumps and compressors from China.
- Steel (HS 7204, 7208) - US$4.13 billion: steel scrap for remelting and flat-rolled products, again led by China.
Pakistan’s 2025 imports by product fall into two main groups: energy products and industrial inputs used by domestic manufacturers.
This means Pakistan’s import value is strongly affected by oil prices and factory demand. When energy costs rise, or manufacturers need more raw materials, the total Pakistan import bill also increases.
That pressure was clear in April 2026, when Pakistan’s trade deficit reached US$4.07 billion, the highest level in 46 months. Monthly imports rose by more than 28%, while export growth remained much slower.
Key points from the import data of Pakistan in 2025:
- Energy dominates Pakistan imports: Mineral fuels account for about one-quarter of total imports, making energy prices a major driver of total Pakistan import value.
- Cotton supports the textile industry: Pakistan imports raw cotton and yarn to supply domestic textile mills, linking imports directly with one of the country’s largest export industries.
- Edible oils are a major food import: Palm oil and soybean oil rank among the largest import goods to Pakistan, creating significant demand for foreign exchange.

TradeInt is a global trade data platform providing access to over 10 billion verified import and export records. Its coverage spans over 200 countries and more than 80 customs data sources.
This article provides a snapshot of Pakistan’s imports. Use TradeInt to explore more detailed trade records and continue tracking this market as new data becomes available. Search Pakistan import records →
⛽ Past Records HS 2710 Petroleum Shipments Into Pakistan On TradeInt
Search the arrival records by origin port, importer, and transaction date.
Access now: Pakistan HS 2710 historical import records by product and HS code
Who is Pakistan's largest import partner 2025?
From Pakistan import records on TradeInt for the 2025 calendar year, the largest import partner is China at US$20.57 billion, ahead of the United Arab Emirates at US$6.95 billion and Indonesia at US$4.34 billion. Next are Saudi Arabia, Qatar, the United States, Japan, Kuwait, Brazil and Iran.
Top 5 countries that export to Pakistan in 2025:
- China - US$20.57 billion: the dominant supplier, led by electronics (HS 85), machinery (HS 84) and steel (HS 72).
- United Arab Emirates - US$6.95 billion: the main energy gateway, sending petroleum (HS 27) and re-exported goods.
- Indonesia - US$4.34 billion: the palm oil and edible fats origin (HS 15), plus paper and coal.
- Saudi Arabia - US$4.15 billion: a crude oil and petrochemical supplier (HS 27, HS 29).
- Qatar - US$3.17 billion: a liquefied natural gas and petroleum origin (HS 27).
✔ South Africa Export Data ✔ South Africa Import DataTradeInt is a global trade data platform covering 200+ countries and 80+ customs sources. Learn about TradeInt →
🪨 South Africa Leads Pakistan Coal Imports
South Africa supplied US$475.19 million of coal to Pakistan in the first half of 2026, more than eight times second-placed Indonesia. Bituminous coal under HS 270112 accounts for nearly the entire trade. Read: Coal imports in Pakistan by country and HS code 2026
Top 1: China
In 2025, China was Pakistan’s largest import source, supplying US$20.57 billion in goods, nearly three times the value of the second-largest supplier. Electronics, machinery and steel were the three leading import categories.
The trade category shows that China is a major supplier of equipment and industrial inputs used by Pakistani manufacturers. As a result, changes in factory investment and production demand can directly affect Pakistan’s import value from China.
Trade also strengthened in the opposite direction. In H1 2026, Pakistan’s exports to China rose 50.7% to US$1.87 billion, led by copper, minerals and agro-industrial products.
Key points about the China–Pakistan import corridor:
- Industrial goods dominate the trade: Electronics (HS 85), machinery (HS 84) and steel (HS 72) are the three largest import chapters from China.
- Capital goods play a major role: Machinery and production equipment make up a significant part of the flow, supporting domestic manufacturing.
Top 2: United Arab Emirates
In 2025, the United Arab Emirates supplied US$6.95 billion in goods to Pakistan. Petroleum products (HS 27) led the import mix, followed by steel and plastics.
Because the UAE is a major regional refining and re-export hub, part of this trade reflects Gulf energy moving through the country rather than only direct UAE production.
In June 2026, Pakistan’s crude petroleum imports rose 74.87% year on year, while petroleum product imports increased 49.53%, strengthening the value of energy-linked trade.
Key points about the UAE–Pakistan import performance:
- Energy dominates the import basket: Petroleum is the largest import category, reflecting the UAE’s role as a major energy supplier and trading hub.
- Oil prices strongly affect import value: Because petroleum carries the largest share, changes in crude prices can move the total value of imports from the UAE even when shipment volumes change less.
Top 3: Indonesia
In 2025, Indonesia supplied US$4.34 billion in goods to Pakistan. Animal and vegetable oils (HS 15) led the import mix, making this corridor different from the energy- and machinery-heavy suppliers above it.
Palm oil sits at the centre of this trade. Because edible oils are a basic household input, demand remains relatively steady even when prices and the wider import bill fluctuate.
In June 2026, Pakistan’s palm oil imports rose 21.06% year on year, showing that edible-oil demand remained firm.
Key notes about the Indonesia–Pakistan import market:
- Edible oils lead the trade: Palm oil and related products account for the largest share, linking the corridor closely to food demand.
- The import category extends beyond oils: Synthetic staple fibre (HS 55) and coal (HS 27) are the next major categories.
- Demand is relatively stable: Food-related imports tend to remain more consistent than industrial goods, giving this corridor steadier demand through market cycles.
✔ US Importer ✔ US ExporterTradeInt is a global trade data platform covering 200+ countries and 80+ customs sources. Learn about TradeInt →
🇺🇸 Pakistan's 6th-Largest US Import Partner
Pakistan sources US$2.76 billion from the United States annually. TradeInt's US import analysis shows what drives the world's largest goods importer, with every top product and source country ranked by value. US import data 2026: Top imports & source countries
How does Pakistan's import market perform in H1 2026?
June 2026 recorded a sharp rise in Pakistan’s imports. Import value reached US$6.93 billion, up 27.08% from May and 29.33% from June 2025, according to a provisional Pakistan Bureau of Statistics report.
Source: Pakistan Bureau of Statistics Advance Release Statement, June 2026.
*US values derived at the implied rate of RS278.3 per US, taken from the release's own rupee and dollar totals for June 2026.
Pakistan’s total imports reached US$69.76 billion in the fiscal year ending June 2026, up from US$64.51 billion a year earlier. This gives a clear answer to how much Pakistan imports over a full fiscal year.
At the same time, exports declined, causing the trade gap to widen. By the first ten months of the fiscal year, Pakistan’s cumulative trade deficit had reached US$31.98 billion, up 20.3% year on year.
Energy and industrial inputs drove much of the increase. Petroleum crude, petroleum products and plastics all recorded strong growth, especially in June.
Noticably, petroleum crude leads the June 2026 commodity list at Rs230,079 million (about US$825 million), ahead of petroleum products at Rs215,780 million (about US$774 million) and electrical machinery at Rs91,833 million (about US$329 million).
Source: Pakistan Bureau of Statistics Advance Release Statement, June 2026.
*US values derived at the implied rate of RS278.3 per US, taken from the release's own rupee and dollar totals for June 2026.
Most major import categories increased in June 2026 compared with May, showing a broad rise in Pakistan import demand.
Among the top Pakistan import categories, energy led the increase. Petroleum crude and petroleum products together accounted for close to one-quarter of the monthly Pakistan import value, and both rose on a monthly and yearly basis.
On the other hand, Pakistan imports of Industrial products also increased. Iron and steel imports climbed 62.08% from May, while steel scrap rose 120% from June 2025, suggesting stronger restocking by domestic mills.
Yet, electrical machinery fell 30.38%, and liquefied natural gas declined 23.81% from June 2025, although both increased compared with May.
Conclusion
Pakistan import data for 2025 shows that mineral fuels led the import basket at US$16.72 billion, followed by electrical machinery at US$6.47 billion and edible oils at US$4.37 billion. China was the largest supplier, contributing US$20.57 billion, or close to one-third of the total import value.
In FY2025–26, Pakistan’s import bill increased 8.14% to US$69.76 billion while exports declined, widening the trade deficit to its highest level in 46 months.
Energy and industrial inputs remain the main drivers of Pakistan's import value, meaning future spending will continue to depend heavily on oil prices and domestic manufacturing demand.
To request global commodity trade data by year and HS code, fill out a contact form to enquire about global data coverage.
Frequently asked questions
What does Pakistan import from the US?
The United States ranked sixth among Pakistan's suppliers in 2025 at US$2.76 billion. Its shipments skew toward raw materials, with cotton (HS 52), oilseeds (HS 12) and iron and steel (HS 72) taking the top three chapters, so the corridor mostly feeds Pakistani mills and crushers.
How much does Pakistan import each year?
The full fiscal year to June 2026 came in at US$69,761 million, roughly US$5.25 billion above the previous year's US$64,507 million. The provisional PBS release puts the increase at 8.72% in rupees and 8.14% in dollars.
Who is Pakistan's largest import partner?
China stands well clear of the field at US$20.57 billion in 2025, close to a third of everything Pakistan buys, followed by the United Arab Emirates at US$6.95 billion and Indonesia at US$4.34 billion. China's strength is electronics, machinery and steel, while the Gulf origins supply the energy lines.
Why does Pakistan import so much oil?
Home output covers only part of national energy needs, so mineral fuels top the basket at US$16.72 billion. The pressure showed in June 2026, when petroleum crude rose 74.87% against a year earlier and crude plus refined products together led the monthly commodity list, keeping energy the single largest draw on foreign exchange.