Malaysia food import data: Malaysia food import insight overview
- Vegetable oil (HS 1511) is Malaysia's single largest food import at US$510.47 million in the January to May 2026 period, far ahead of any other food category under HS Chapters 01-24.
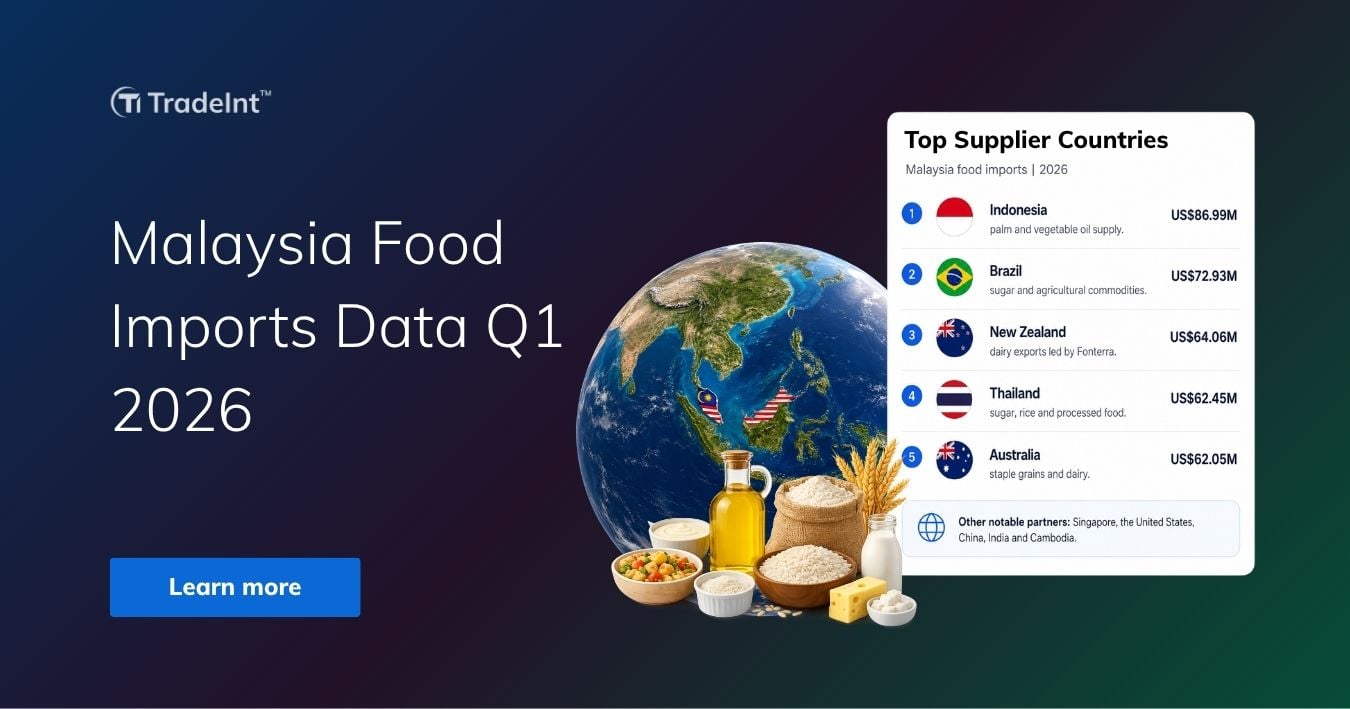
- Indonesia is the top food-supplying country at US$86.99 million, followed by Brazil at US$72.93 million and New Zealand at US$64.06 million, showing a supplier base split between regional neighbours and long-haul agricultural exporters.
- Padiberas Nasional Berhad, Malaysia's national rice body, leads the importer table, confirming that state-linked procurement drives a large share of the country's food inflows.
- In 2024, Malaysia's Food Security Index rose to 61.5 from 54.5 a year earlier, with the accessibility dimension at 79.9 supported by imports covering domestic shortfalls, on Department of Statistics Malaysia figures published in July 2026.
What are the HS codes for food in different food categories?
Food in global trade encompasses edible goods classified under HS Chapters 01 to 24, ranging from raw agricultural commodities to processed consumer products. This article tracks that basket through six food lines that shape Malaysia's inflows, grouped below by trade role.

TradeInt is a global trade data platform providing access to over 10 billion verified import and export records. Its coverage spans over 200 countries and more than 80 customs data sources.
This article provides an overview of Malaysia’s food imports. Use TradeInt to explore more detailed trade records and continue tracking this market as new data becomes available. Search Malaysia food import records →
🇲🇾 Preview Malaysia Import Export Trade Records on TradeInt
Malaysia is one of Southeast Asia's top trading economies. This trade statistics overview by TradeInt covers Malaysia's top import and export categories by HS code, key trading partners, and major buyers and suppliers, with shipment-level customs records.
Preview here: Malaysia import export trade records by HS code or product name
How is the food import market performing in Malaysia in 2026?
From TradeInt's Malaysia food import records, the value across the tracked HS food lines peaked at US$1.01 billion in Q1 2025 before declining steadily to US$567.68 million in Q1 2026, a 43.59% drop over four quarters and the lowest point in the series.
✔ Malaysia Importer ✔ Malaysia ExporterTradeInt is a global trade data platform covering 200+ countries and 80+ customs sources. Learn about TradeInt →
📦 TradeInt's Coverage on Malaysia Import Market Q1 2026
Electronic integrated circuits (HS 8542) top Malaysia's imports at US$22.19 billion in Q1 2026, with China the largest origin at US$23.48 billion. This TradeInt's analysis covers import market value trends QoQ, top buyers and suppliers, global import partners, and highlights import categories.
Read more: Malaysia import data Q1 2026: Products, partners & analysis
The pullback in Malaysia's food import market around early 2026 reflected softer agricultural inflows rather than a broad weakening in trade activity. In January 2026, Malaysia's agricultural imports fell 12.8% year on year to RM7.30 billion (~US$1.63 billion), even as total imports grew 5.3% to RM125.50 billion (~US$27.97 billion), according to Department of Statistics Malaysia data. Consumer-ready lines proved more resilient than industrial inputs in the same period.
Key points about Malaysia's food import trend:
- Consumer food held up, industrial inputs fell sharply. Imports of processed food and beverages for household consumption rose 3.9%, while primary food and beverages for industry dropped 32.2%, showing end-consumer demand staying firm as factory procurement pulled back.
- The food-specific drag was not a trade-wide signal. Agriculture's 12.8% decline contrasted with overall import growth of 5.3%, meaning only food categories contracted while other goods expanded.
Malaysia's food import market faces rising cost pressure into the second half of 2026, with fertiliser prices climbing about 50% to around US$700 a tonne after Gulf supply disruptions, on Fitch Ratings analysis from April 2026. Higher input costs lift production expenses across agribusiness supply chains, feeding through into import prices for wheat, dairy, and processed food that Malaysia cannot fully source domestically.
The rankings show Malaysia's food import dependence at about 10%, lower than mid-teen levels in the Philippines and Bangladesh, yet any coincidence of weaker domestic harvests and elevated global prices passes directly into consumer food costs.
What food item does Malaysia import the most? Malaysia food import data
Based on TradeInt's Malaysia food import records for the January to May 2026 period, the leading food imports are vegetable oil (HS 1511) at US$510.47 million, food preparations (HS 2106) at US$128.99 million, and wheat (HS 1001) at US$66.20 million. Malaysia's food imports also cover rice, dairy, and sugar.
Top Malaysia food imports in 2026:
- Vegetable oil (HS 1511) - US$510.47 million: a primary edible-oil input for domestic food processing, refining, and blending.
- Food preparations (HS 2106) - US$128.99 million: specialised ingredients, supplements, and flavour formulations for consumer-food manufacturing.
- Wheat (HS 1001) - US$66.20 million: a staple grain feeding flour mills, bakery output, and noodle production.
- Rice (HS 1006) - US$52.68 million: an essential dietary staple securing national food supply and household consumption.
- Dairy, milk and cream (HS 0402) - US$5.28 million: a processing feedstock for dairy, beverage, and confectionery manufacturing.
✔ Lite ✔ Pro ✔ Premium ✔ EnterpriseTradeInt is a global trade data platform covering 200+ countries and 80+ customs sources. Learn about TradeInt →
🥬 TradeInt's Insights on Malaysia Vegetable Imports
TradeInt's data on Malaysia HS 07 (vegetables) imports show a new market record in 2025, with China alone supplying over 58% of the market, ahead of India and Pakistan.
Read more: Malaysia vegetable import HS 07 trade statistics
Vegetable oil
Indonesia's decision on May 20, 2026, to route palm oil exports through a state-owned enterprise directly affected Malaysia's largest food import line.
Malaysia imports vegetable oil for domestic refining and blending despite being the world's second-largest palm oil producer at around 30% of global supply, meaning any disruption to Indonesian flows tightens the feedstock available to local processors.
The policy reshaped regional sourcing conditions almost immediately, as Indonesian producers rushed to move cargo at competitive prices ahead of the new compliance requirement, FoodNavigator found.
- Malaysia gained limited room to substitute: Ageing plantations and stagnating yields cap Malaysia's ability to absorb any Indonesian supply gap, with around 35% of oil palm plantations set to be at least 19 years old by 2027.
- The compliance layer adds procurement risk: Buyers sourcing Indonesian oil now pass through an additional state channel, raising uncertainty over pricing and timing for Malaysian refiners and food manufacturers.
Rice
Malaysia's rice imports from Vietnam declined in the January to May 2026 period even as the broader bilateral trade relationship expanded sharply. Vietnam's rice exports to Malaysia fell 4.1% while its total exports to the country grew 25.8%, on General Department of Vietnam Customs data via the Ministry of Industry and Trade, showing Malaysia's rice procurement is shifting across suppliers even as overall food trade with Vietnam grows. Cambodia also appeared in Malaysia's top ten food origins over the period, handled by City Rice Import Export Co Ltd, reflecting active diversification at the buyer level.
- State procurement shapes rice volumes: Padiberas Nasional Berhad, Malaysia's national rice procurement body, holds the largest recorded share of food imports, meaning rice sourcing decisions reflect national stockpile strategy as much as price.
- Vietnam faces intensifying competition. In early 2026, Vietnam's rice exports to Malaysia rose 155% in the first two months before easing over the five months, according to the Ministry of Industry and Trade figures, pointing to volatile demand that other suppliers are moving to capture.
Dairy and sugar
Malaysia's dairy and sugar import lines face a cost squeeze that originates upstream in agricultural production rather than in the food market itself.
Gulf supply disruptions pushed urea prices up about 50% to around US$700 a tonne by April 2026, on Fitch Ratings analysis, raising production costs for dairy farmers and sugar cane growers in Malaysia's key supplier countries including New Zealand, Ukraine, Brazil, and India. Higher farm-gate input costs translate into higher export prices, which Malaysia uses as a net importer of both commodities.
- New Zealand dairy carries the highest unit exposure: Fonterra leads New Zealand's supply to Malaysia, and any cost-driven price increase on milk powder and cream directly lifts Malaysia's dairy import bill given the absence of a domestic substitute at scale.
- Sugar refining margins are already thin: MSM Prai Berhad, Malaysia's flagship sugar refiner, sources raw cane from long-haul origins including Brazil and India, meaning freight and input-cost increases compound at each stage before reaching the domestic market.
Which country does Malaysia import the most food items from in 2026?
Indonesia exported the most food to Malaysia, valued at US$86.99 million, then Brazil at US$72.93 million, and New Zealand at US$64.06 million. The top 10 Malaysia food import by country, from TradeInt's data, also includes Thailand, Australia, Singapore, the US, China, India, and Cambodia.
Top 5 food import partners in Malaysia 2026:
- Indonesia at US$86.99 million: the leading source, driven by palm and vegetable oil supply.
- Brazil at US$72.93 million: a major long-haul supplier of sugar and agricultural commodities.
- New Zealand at US$64.06 million: a specialised dairy exporter, led by Fonterra.
- Thailand at US$62.45 million: a regional supplier of sugar, rice, and processed food.
- Australia at US$62.05 million: a staple-grain and dairy source, led by Cargill Australia.
✔ Lite ✔ Pro ✔ Premium ✔ EnterpriseTradeInt is a global trade data platform covering 200+ countries and 80+ customs sources. Learn about TradeInt →
📋 TradeInt's Guide to Malaysia Import Rules
Malaysia's import exemptions are governed mainly by the Customs Duties (Exemption) Order 2017, shaping which food and industrial goods qualify for relief.
Read more: Malaysia import exemption list explained
Indonesia
Indonesia leads Malaysia's food origins, but its export policy turned into the key variable of 2026. On May 20, 2026, Indonesia named palm oil a strategic commodity to be routed through a state enterprise, prompting a rush by Indonesian producers to move cargo at competitive prices, FoodNavigator found.
- The policy tightened control over flows: From mid-2026, designated commodity exports must pass through the state channel, adding a compliance layer for buyers sourcing Indonesian oil.
- Malaysia gained limited room to substitute: In 2026, Malaysia produced around 30% of the world's palm oil, yet ageing plantations and stagnating yields capped its ability to fully absorb any Indonesian gap.
Vietnam
Vietnam supplies much of Malaysia's imported rice, and 2026 brought a mixed picture.
In the first five months of 2026, Vietnam-Malaysia two-way trade reached US$8.79 billion, up 39.4% year on year, yet Vietnam's rice exports to Malaysia slipped 4.1% amid stronger competition, according to Vietnam Customs data provided by TradeInt.
- Malaysia is a priority rice market. In the first two months of 2026, Vietnam's rice exports to Malaysia rose 155%, based on Ministry of Industry and Trade figures, before the five-month total eased, showing volatile month-to-month demand.
- Broader trade kept expanding. In the same five-month window, Malaysia's imports from Vietnam grew 46.4%, led by electronics and production inputs rather than food, reflecting a widening industrial link.
New Zealand
New Zealand ranks third among Malaysia's food origins, anchored by dairy that domestic output cannot replace. In January 2026, Malaysia's imports of food and beverages classed as primary for household consumption rose 5.7%, based on Department of Statistics Malaysia data, supporting steady dairy demand.
- Imports fill a structural gap: For 2024, Malaysia's Food Security Index scored highest on accessibility at 79.9, which the statistics department linked to imports covering domestic production shortfalls.
- Input costs threaten margins: In April 2026, Fitch warned that higher fertiliser and energy costs could lift processed-food prices in the second half of 2026, pressuring dairy-heavy supply chains.
Malaysian food importers: Who are the biggest food buyers in Malaysia?
Among the verified list of global food buyers on TradeInt, Malaysia's leading food importers are Padiberas Nasional Berhad, MSM Prai Berhad, FFM Berhad, Mewah Oils Sdn Bhd, and Kara Marketing M Sdn Bhd, with main imports being rice, sugar, flour, and edible-oil processing.
Top 5 Malaysian food item importing companies in 2026:
- Padiberas Nasional Berhad: Malaysia's national rice procurement body managing stockpiles, imports, and distribution.
- MSM Prai Berhad: Malaysia's flagship sugar refiner producing and distributing refined sugar across regional markets.
- FFM Berhad: a premier agribusiness and flour miller producing livestock feed, wheat flour, and consumer foods.
- Mewah Oils Sdn Bhd: a palm-oil processor refining, packaging, and exporting edible oils and fats.
- Kara Marketing M Sdn Bhd: an FMCG distributor specialising in coconut products, canned foods, and grocery goods.
How to get the latest Malaysia food import data and verified suppliers?
Most buyers start with public channels: the Department of Statistics Malaysia for monthly trade summaries, agencies such as MATRADE and FAO for market context, and B2B directories for supplier leads. These sources give useful aggregates, yet they stop at totals and rarely show which company shipped what, from which port, and to whom.
A four-step workflow for food sourcing:
- Start at the HS line. Search a food code such as HS 1511 or HS 1006 to see which importers and origins appear in historical shipment records.
- Map the counterparty. Check whether a company appears on the buyer side, the supplier side, or both, and review its shipment history.
- Trace the corridor. Follow ports of loading and discharge to confirm a supplier actually serves the Malaysian market.
- Screen before contracting. Review shipment frequency and company profiles to test consistency ahead of commercial talks.
To start, preview historical Malaysia food import records by product and HS code to understand more about the overall market before deciding on the TradeInt platform.
Conclusion
Malaysia food import data in 2026 shows vegetable oil leading at US$510.47 million, ahead of food preparations at US$128.99 million and wheat at US$66.20 million. Indonesia is the top supplier at US$86.99 million, followed by Brazil at US$72.93 million and New Zealand at US$64.06 million, with Padiberas Nasional Berhad heading a buyer table driven by state-linked rice and sugar procurement.
With food import dependence near 10% and Indonesia's palm oil export overhaul reshaping regional supply flows, transaction-level data gives a clearer picture than annual totals alone.
Reach out to the TradeInt platform specialist today to access detailed Malaysia food import data by shipment, supplier, and HS code.