Key takeaways about the US top export items in Q1 2026
- Gold (HS 7108) is the US largest export in Q1 2026 at US$44.89 billion (7.47% share), with precious metals reaching 15% of total US export value by February 2026, according to Progressive Policy Institute and global trade data records from TradeInt, overtaking energy, aerospace, and agriculture to become the top US export leader.
- Energy products dominate three of the top US exports: refined petroleum (HS 2710) at US$29.64 billion, crude oil (HS 2709) at US$26.22 billion, and petroleum gases/LNG (HS 2711) at US$24.05 billion, dominated by Mexico, Latin America, Europe, and East Asian buyers.
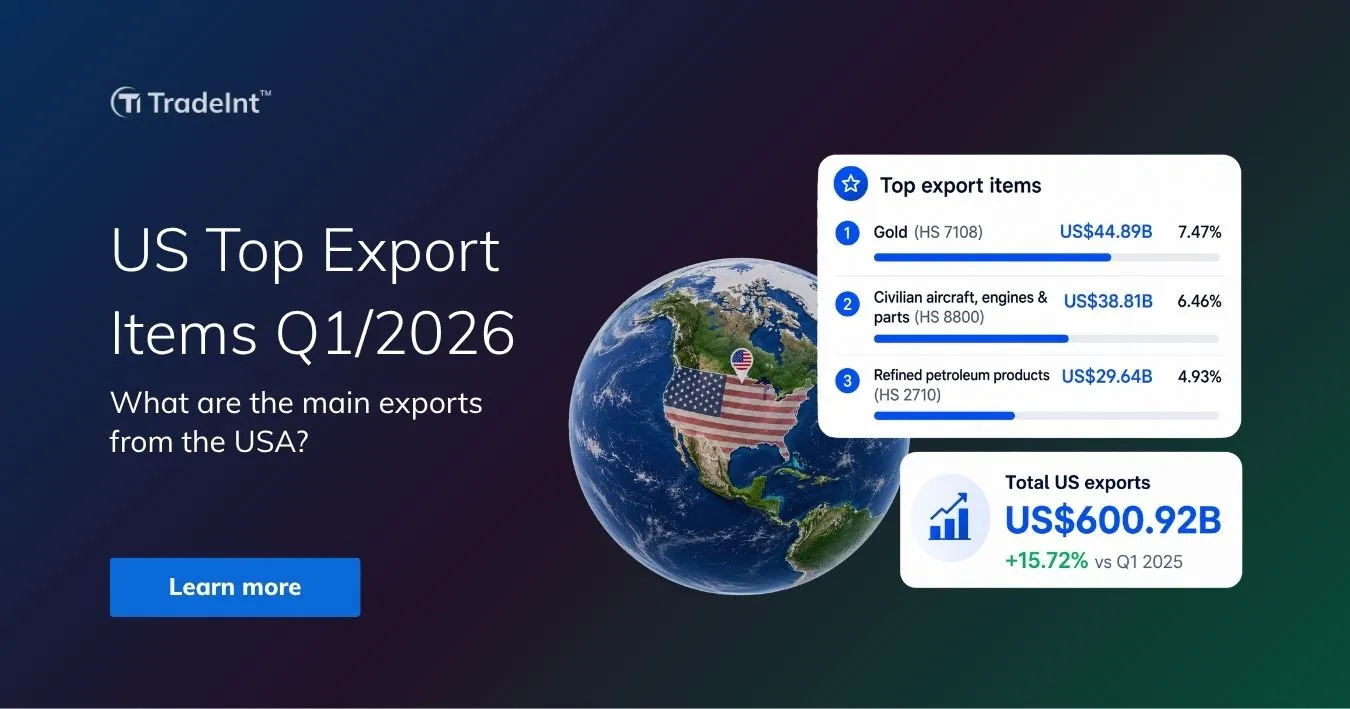
- US exports hit a record US$600.92 billion in Q1 2026, up 15.72% from the Q1 2025 baseline of US$519.29 billion. The top 10 US exports collectively cover gold, aerospace, energy, IT hardware, and biopharmaceutical categories.
 ✔ U.S. Import & Export Trade Data
📚 US Export Data Analysis 2025 by TradeInt, the global trade data platform
Mexico led US export destinations in 2025 at US$336.19 billion (15% share), reinforcing North American supply chain dominance. Uncover the full US export landscape across partners and HS chapters.
Read more: United States Export Data 2025: Top Partners, Products Analysis
US top export items: What are the main exports from the USA?
US's main exports are gold (HS 7108) in Q1 2026 at US$44.89 billion (7.47% share), followed by civilian aircraft (HS 8800) at US$38.81 billion (6.46%) and refined petroleum (HS 2710) at US$29.64 billion (4.93%), drawn from TradeInt's Official US Export Data and Bill of Lading Database.
The top 10 US exports, when combined, account for over 40% of total US outbound value, with gold overtaking aerospace and petroleum to claim the largest of the top US export categories.
Top 5 US export items in Q1 2026:
- HS 7108 - Gold: US$44.89 billion (7.47%): Gold, unwrought, semi-manufactured, or in powder form, channeled through Mexico, Indonesia, and Vietnam.
- HS 8800 - Civilian aircraft, engines, and parts: US$38.81 billion (6.46%): Boeing, GE Aviation, and Raytheon-led aerospace shipments to commercial fleets globally.
- HS 2710 - Refined petroleum products: US$29.64 billion (4.93%): Gasoline, diesel, jet fuel, and other refined fuels, anchored by Mexico, Peru, Chile, and the Dominican Republic.
- HS 2709 - Crude petroleum oil: US$26.22 billion (4.36%): Light sweet crude shipments to the Netherlands, South Korea, Spain, and Canada for refining and feedstock.
- HS 2711 - Petroleum gases and LNG: US$24.05 billion (4%): Liquefied natural gas and petroleum gases, led by Mexico, Vietnam, Bangladesh, DR Congo, and India.
✔ U.S. Import & Export Trade Data
🇺🇸 TradeInt's Trade Statistics on US Imports
TradeInt generates US trade summaries, including the US top imported & exported products, HS codes up to 12 digits, importer and exporter names, countries of origin, and destination.
Explore more: US import export trade insights summary by HS code and year
US largest export product: HS 7108 Gold at US$44.89 billion
Mexico received US$32.36 million in HS 7108 gold shipments from the United States (26.68%), followed by Indonesia at US$29.70 million (24.48%) and Vietnam at US$21.59 million (17.80%), drawn from TradeInt's latest verified customs records.
India and Malaysia round out the top 5 with US$16.78 million (13.83%) and US$7.85 million (6.47%), respectively, reflecting a globally distributed precious-metals flow.
Top 5 HS 7108 gold exporting countries from the US in Q1 2026:
- Mexico - US$32.36 million (26.68%): Supplies raw material for industrial electronics and jewelry manufacturing.
- Indonesia - US$29.70 million (24.48%): Supports domestic jewelry fabrication and central bank reserve accumulation.
- Vietnam - US$21.59 million (17.80%): Provides bullion for retail wealth preservation and industrial usage.
- India - US$16.78 million (13.83%): Fulfills high consumer demand for cultural jewelry and financial investment.
- Malaysia - US$7.85 million (6.47%): Serves as input for precision electronics and retail bullion trading.
✔ Lite ✔ Pro ✔ Premium ✔ Enterprise
🥇 HS 7108 US Gold Export Records on TradeInt's Global Trade Database
The US exported US$44.89 billion in gold (HS 7108) in Q1 2026. Check out the list of US exporters and shipment-level customs details through TradeInt's HS 7108 export search.
Access here for: US past HS 7108's global trade records
Gold has reshaped the entire US export mix in 2026, claiming the position as the US largest export by HS value.
Analysis from the Progressive Policy Institute documents that precious metals (HTS 72), which typically make up about 4% of US export values, reached 7% across 2025 and surged to 15% by February 2026, overtaking energy, airplanes, agriculture, and cars to become the single largest US export category. About 260 tons of gold flowed out of US vaults under Wall Street to global hubs in London, Zurich, and Hong Kong over the past year.
Key market signals shaping HS 7108 US gold export flows:
- January 2026 BEA release: Nonmonetary gold exports increased US$4.7 billion in January 2026 alone, with other precious metals adding another US$4.1 billion, pushing total US exports to a record US$302.1 billion.
- Central bank demand surge: Industry survey data shows 68% of the world's central banks plan to add to their gold holdings in 2026, up from 62% the previous year, reinforcing the structural buying base for outbound US gold flows.
- Wall Street vault drainage: Most of the gold leaving the US is foreign gold that was processed through US vaults during 2024-2025 institutional hedging cycles, now being shipped back out to global buyers across precious-metals trading centers.
US top #2 export product: HS 8800 Civilian aircraft at US$38.81 billion
Civilian aircraft (HS 8800) is the second-largest US top export at US$38.81 billion (6.46%) in Q1 2026, sourced from TradeInt's Official US Export Data and Bill of Lading Database.
The category covers commercial passenger aircraft, civilian jet engines, helicopters, and associated parts shipped through Boeing's Seattle and Charleston facilities and a deep network of Tier-1 and Tier-2 aerospace component manufacturers across Washington, South Carolina, Kansas, and Texas.
Key market signals shaping HS 8800 US aerospace export flows in Q1 2026:
- Record January exports: BEA's January 2026 data shows civilian aircraft contributed materially to the US$302.1 billion record monthly export total, with aerospace alongside computers, computer accessories, and precious metals leading the headline categories.
- Global fleet replenishment demand: Airlines across Europe, Asia, and the Middle East continue to renew narrowbody and widebody fleets, supporting backlogged Boeing 737 MAX, 787, and 777 delivery schedules through 2026.
- Cross-region delivery flows: US civilian aircraft exports historically flow to Ireland (Boeing leasing hub), the UAE, China, the UK, and Germany; the Q1 2026 value confirms aerospace as one of the most concentrated dollar-volume export categories in US trade.
US top #3 export product: HS 2710 Refined petroleum at US$29.64 billion
Verified by TradeInt's Q1 2026 trade records, Mexico leads US refined petroleum imports (HS 2710) at US$5.65 billion (42.48%), followed by the United States itself (re-classification flows) at US$4.00 billion (30.08%) and Peru at US$1.22 billion (9.16%). Chile and the Dominican Republic complete the top 5 with US$643.03 million (4.83%) and US$614.63 million (4.62%), respectively, reflecting strong regional Latin American demand for US refined fuels.
Top 5 HS 2710 refined petroleum exporting countries from the US in Q1 2026:
- Mexico - US$5.65 billion (42.48%): Fuels commercial transit networks and national electricity generation.
- United States - US$4.00 billion (30.08%): Re-imported for domestic fuel blending, storage, or regional reallocation.
- Peru - US$1.22 billion (9.16%): Powers commercial mining logistics and domestic transport infrastructure.
- Chile - US$643.03 million (4.83%): Supplies essential energy for large-scale industrial mining operations.
- Dominican Republic - US$614.63 million (4.62%): Fuels electrical power grids and commercial tourism infrastructure.
Refined petroleum continues to set new benchmarks in 2026 as US Gulf Coast refineries operate at high utilization to feed both Latin American demand and supplemental Middle East-bound flows, cementing its position as a major export of US origin. EIA-cited Vortexa Analytics data shows maritime exports of clean petroleum products (gasoline, diesel, LPG, jet fuel) averaged 6.3 million barrels per day in January 2026, up about 10% from January 2025 and near record highs.
Key market signals shaping HS 2710 US refined petroleum export flows:
- Latin America anchor: Mexico's 42.48% share confirms its role as the dominant single buyer of US refined fuels, with the top-5 Latin American block collectively absorbing roughly 91% of disclosed Q1 2026 HS 2710 shipments.
- Middle East product flow expansion: Per CNBC reporting, refined product exports from Corpus Christi to the Middle East in Q1 2026 already exceeded the full-year 2025 volume, reflecting the post-Strait-of-Hormuz rerouting of global product flows.
- Refinery utilization premium: Strong, sustained refinery utilization across Texas and Louisiana facilities supports near-record clean-product exports, with structural advantages including deepwater terminals, pipeline capacity, and inland feedstock access.
US top #4 export product: HS 2709 Crude petroleum oil at US$26.22 billion
The Netherlands leads US crude petroleum exports (HS 2709) at US$1.54 billion (27.60%), followed by South Korea at US$645.28 million (11.58%) and Spain at US$386.20 million (6.93%). Canada ranks fifth at US$304.94 million (5.47%), data from TradeInt's verified US customs records.
Top 5 HS 2709 crude petroleum oil exporting countries from the US in Q1 2026:
- Netherlands - US$1.54 billion (27.60%): Primary feedstock for major European refining and petrochemical hubs centered in Rotterdam.
- South Korea - US$645.28 million (11.58%): Feeds domestic refineries to produce refined petroleum products for industrial and transportation use.
- Spain - US$386.20 million (6.93%): Supplies industrial oil refineries to secure Southern European energy throughput.
- Locked entry (#4): Full top-10 importer detail available on the TradeInt platform.
- Canada - US$304.94 million (5.47%): Used for refinery feedstock blending and cross-border energy supply management.
✔ Lite ✔ Pro ✔ Premium ✔ Enterprise
⛽ US Petroleum Export Data Trade Records by Product Name on TradeInt
US exported nearly US$80 billion in petroleum products (refined, crude, and gases) in Q1 2026. Get access to top verified US petroleum suppliers, destination countries, and shipment-level Bill of Lading detail by product.
Access here for: US HS 2709 export global trade records 2025
US crude oil exports hit unprecedented levels in 2026, defining one of the most consequential structural shifts in global energy trade.
CNBC's May 2026 reporting documented that US oil exports surged to 5.2 million barrels per day in April 2026, a more than 30% increase over the 3.9 mbpd recorded in February 2026 before the Middle East conflict. The Port of Corpus Christi alone handled half of US crude exports in April 2026, with Q1 2026 marking its busiest quarter on record.
Key market signals shaping HS 2709 US crude oil export flows:
- Record 250 million barrels shipped: Bloomberg analysis cited in May 2026 reported more than 250 million barrels of US crude shipped abroad over the prior nine weeks, repositioning the US as the world's largest crude exporter amid the closure of the Strait of Hormuz.
- VLCC traffic doubled: 50 to 60 Very Large Crude Carriers (each carrying up to 2 million barrels) were heading to US ports daily in April 2026, double the prior-year volume, with 28 VLCCs already booked for May loadings against a typical monthly average of 5.
- Atlantic and Pacific corridor balance: Q1 2026's top 5 disclosed importers (Netherlands, South Korea, Spain, Canada) reflect a balanced Atlantic-Pacific crude export footprint, with European refining hubs and East Asian processors anchoring volumes through Corpus Christi and Houston.
US top #5 export product: HS 2711 Petroleum gases and LNG at US$24.05 billion
According to TradeInt's Q1 2026 verified shipment data, Mexico leads US petroleum gas and LNG imports (HS 2711) at US$2.68 billion (52.01%), followed by Vietnam at US$396.61 million (7.71%) and Bangladesh at US$395.61 million (7.69%). The Democratic Republic of the Congo and India round out the top 5 with US$335.92 million (6.53%) and US$303.96 million (5.91%), respectively, illustrating US LNG and petroleum-gas flows reaching North American, Southeast Asian, African, and South Asian end-markets.
Top 5 countries importing HS 2711 petroleum gases from the US in Q1 2026:
- Mexico - US$2.68 billion (52.01%): Generates electricity and fuels heavy industrial manufacturing sectors.
- Vietnam - US$396.61 million (7.71%): Powers industrial manufacturing zones and expanding electricity grids.
- Bangladesh - US$395.61 million (7.69%): Critical fuel source for national power generation and industrial factories.
- Democratic Republic of Congo - US$335.92 million (6.53%): Provides essential power for mining operations and regional transport.
- India - US$303.96 million (5.91%): Feeds agricultural fertilizer production and residential cooking gas networks.
US LNG and petroleum gas exports set an all-time high in early 2026. Total crude-plus-products exports reached nearly 12.9 million barrels per day in mid-April 2026, with LNG exports setting an all-time high in March 2026. The boom reflects Europe and Asia turning to reliable US supplies of natural gas to offset Middle East supply disruptions.
Key market signals shaping HS 2711 US LNG and petroleum gas export flows:
- March 2026 record month: US LNG exports reached an all-time high in March 2026, with the Sabine Pass, Corpus Christi, Cameron, Freeport, and Cove Point terminals collectively operating near peak capacity.
- Multi-region buyer base: The Q1 2026 top-5 mix (Mexico, Vietnam, Bangladesh, DRC, India) spans four continents, illustrating LNG's role as a globally fungible energy product with broad downstream end-uses across power generation, industrial, and residential demand.
- Mexico's dominant single-buyer position: Mexico's 52.01% share reflects deep pipeline integration along the US-Mexico border, with cross-border natural gas flows supporting Mexican electricity generation and industrial manufacturing.
US export growth trends: Exports hit a record US$600.92B in Q1 2026
US exports rose 15.72% from US$519.29 billion in Q1 2025 to a record US$600.92 billion in Q1 2026, marking the highest quarterly value across the five-quarter window, according to TradeInt's market trends analysis.
The peak quarter within the period was Q1 2026 itself (+6.69% QoQ), with each successive quarter showing modest expansion punctuated by a brief Q3 2025 pullback before the year-end and early-2026 acceleration.
Quarterly US export value trends across the past five quarters:
- Q1 2025: US$519.29 billion (+1.77% QoQ): Steady early-year baseline, with stable demand across capital goods and commodities.
- Q2 2025: US$549.66 billion (+5.85% QoQ): Accelerated growth driven by rising commodity values and strengthening international demand.
- Q3 2025: US$540.30 billion (-1.70% QoQ): Brief mid-year cooling reflecting normal seasonal patterns and end-of-summer logistics adjustments.
- Q4 2025: US$563.22 billion (+4.24% QoQ): Strong year-end recovery as fourth-quarter international trade logistics peaked.
- Q1 2026: US$600.92 billion (+6.69% QoQ): Record-breaking quarterly value, anchored by precious metals, aerospace, and energy export surges.
✔ Lite ✔ Pro ✔ Premium ✔ Enterprise
📊 TradeInt's Market Trade Insight Analysis Feature for US Export Cycles
From precious metals surges to record energy outflows and aerospace deliveries, TradeInt's market trade insights uncover port-level trade insights, shipment volumes, pricing benchmarks, and trade concentration patterns between countries.
Discover TradeInt's Market Trade Insight platform feature
Cross-checking the quarterly trend against monthly data confirms the upward trajectory in the top 10 US exports. The US Bureau of Economic Analysis January 2026 release tracked US exports at a record US$302.1 billion (up US$15.8 billion from December, a 5.5% MoM increase), led by nonmonetary gold (+US$4.7B), other precious metals (+US$4.1B), capital goods (+US$5.4B), computers (+US$2.6B), and civilian aircraft (+US$1.6B). Goods exports continued to accelerate through February and March 2026 as gold, energy, and aerospace flows compounded.
Key signals from the five-quarter US export trend:
- Record peak in Q1 2026: The US$600.92 billion quarterly value is the highest in the five-quarter window, lifting the year-over-year US export trajectory to a new structural high, with the best US exports across precious metals, aerospace, and energy delivering the volume gain.
- Precious metals and energy lead: Three of the top US exports (HS 7108 gold, HS 2710 refined petroleum, HS 2709 crude oil) anchor the cycle, with the combined value of these major exports of US origin exceeding US$100 billion across Q1 2026 alone.
- USMCA review backdrop: Research from the Brookings Institution's USMCA Forward 2026 highlights the July 2026 USMCA joint review as a structural inflection point for North American trade, with Mexico remaining the US's largest export destination at US$337 billion in 2025.
Conclusion
The Q1 2026 US export mix tells a clear story: precious metals and energy have eclipsed the country's traditional export pillars.
Gold (HS 7108) at US$44.89 billion now leads the US's largest export ranking ahead of civilian aircraft and refined petroleum, while crude oil, LNG, IT hardware, integrated circuits, and biopharmaceuticals fill out the top 10 US exports.
Each lane carries its own buyer concentration, port footprint, and shipment cadence. Book a demo with TradeInt to explore.
Frequently asked questions
What are the main exports from the USA?
The main exports from the USA in Q1 2026 are gold (HS 7108) at US$44.89 billion, civilian aircraft (HS 8800) at US$38.81 billion, refined petroleum (HS 2710) at US$29.64 billion, crude oil (HS 2709) at US$26.22 billion, and petroleum gases/LNG (HS 2711) at US$24.05 billion, according to TradeInt's US export data.
What is America's No. 1 export?
America's No. 1 export in Q1 2026 is gold (HS 7108) at US$44.89 billion (7.47% share), verified by TradeInt's US export records. Gold overtook civilian aircraft and energy products to become the largest single export category, with most outbound flows reaching Mexico, Indonesia, Vietnam, India, and Malaysia.
Which products does the US export?
The US exports precious metals, aerospace equipment, energy products, IT hardware, and biopharmaceuticals. From TradeInt's Q1 2026 global export data, energy products such as crude oil, refined petroleum, and LNG fill three of the top 5 US export items, with gold leading as the top US export item and civilian aircraft second.