What are the US top import products in Q1 2026?

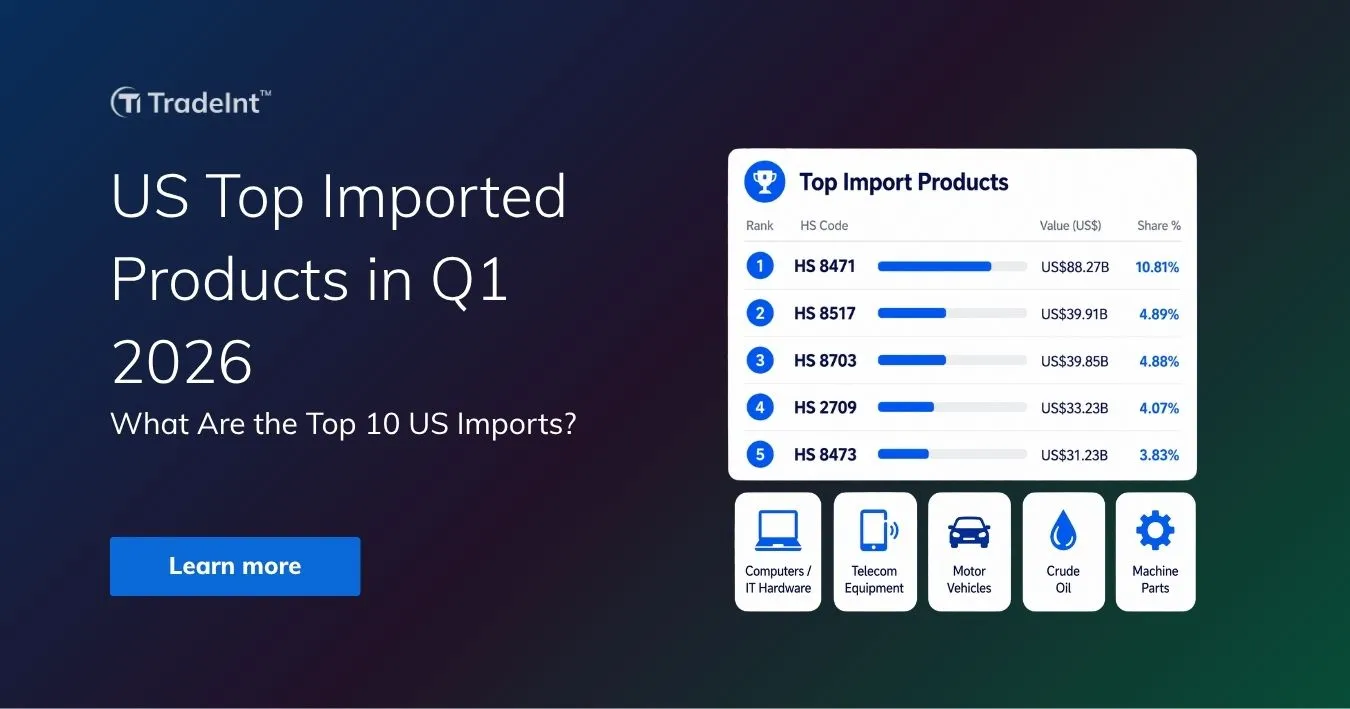
TradeInt banner titled "US Top Imported Products in Q1 2026" featuring a chart of top imported products like IT hardware and telecom equipment.

Key takeaways about US top import products

  • Automatic data processing equipment (HS 8471) is the #1 US top import product in Q1 2026 at US$88.27 billion (10.81%), with Mexico supplying 83.63% via deeply integrated nearshoring across border-state IT hardware plants.
  • Mexico accounts for 7 of the top 10 US top import products by leading supplier share, dominating HS 8471, 8703, 8708, 8473, 9801, 8542 (#3 in chips), and ranking second in HS 3002 and 3004, confirming the structural depth of the USMCA nearshore supply chain.
  • US imports stabilized at approximately US$816 billion quarterly through Q1 2026, down 12.66% from the Q1 2025 peak of US$934.65 billion, reflecting careful inventory management by US importers amid ongoing trade-policy uncertainty.

What are the top 10 US import products based on Q1 2026 US import data? US top import products

The top 10 US top imported products in Q1 2026 are led by automatic data processing equipment (HS 8471) at US$88.27 billion (10.81%), followed by telephones for cellular networks (HS 8517) at US$39.91 billion (4.89%) and motor vehicles (HS 8703) at US$39.85 billion (4.88%), per Official TradeInt US import data and Bill of Lading records. These ten 4-digit HS categories together account for over 40% of total US imports during January-March 2026.

Top 5 US imported products in Q1 2026:

  • HS 8471 - Automatic data processing equipment: US$88.27 billion (10.81%). The single largest US import category, covering computers, servers, laptops, and IT hardware components.
  • HS 8517 - Telephones and cellular network equipment: US$39.91 billion (4.89%). Smartphones and wireless network gear, with Mexico, Vietnam, and India anchoring the supplier base.
  • HS 8703 - Motor vehicles: US$39.85 billion (4.88%). Passenger cars and traveling vehicles, dominated by Mexico through deeply integrated North American supply chains.
  • HS 2709 - Petroleum crude oil: US$33.23 billion (4.07%). Crude oil imports anchored by Canada, with the US itself, Mexico, Saudi Arabia, and Panama rounding out the top sources.
  • HS 8473 - Parts and accessories for machines: US$31.23 billion (3.83%). Mexico leads supply followed by Malaysia and Vietnam, reflecting the deep nearshoring trend in the IT hardware components segment.

US Top Imported Products Q1 2026
Rank 4-Digit HS Code Value (US$) Share % Product Description
18471$88,270,876,02910.81%Automatic data processing equipment and its components
28517$39,908,739,3504.89%Telephones, including telephones used in cellular networks or other wireless networks
38703$39,850,192,3034.88%Motor vehicles mainly used to carry people, including traveling cars and racing cars
42709$33,230,137,2084.07%Petroleum crude oil and crude oil extracted from bituminous minerals
58473$31,230,734,1503.83%Parts and accessories dedicated or mainly used for machines
69801$26,629,687,4833.26%Uncategorized goods
78708$19,840,899,7532.43%Parts and accessories of motor vehicles
83002$17,567,457,7642.15%Human blood; animal blood products for treatment, prevention, or diagnosis
93004$16,913,609,9322.07%Medicines for the treatment or prevention of diseases consisting of mixed or non-mixed products
108542$12,829,296,1281.57%integrated circuit
Data Source: Official TradeInt US Import Data and Bill of Lading Database
Period: January-March 2026.
TradeInt logo ✔ US Import Data   ✔ HS Code

📊 US Import Data Analysis 2025 by TradeInt

Machinery and mechanical appliances led US imports in 2025 at US$647.29 billion (19.28%), followed by electrical equipment at US$498.22 billion. Explore the full US import landscape across categories.

Read more: US Import Data 2025

Top 1 imports into the US: Automatic data processing equipment at US$88.27 billion

From TradeInt's verified US trade database, Mexico dominates US imports of automatic data processing equipment (HS 8471) at US$35.63 billion (83.63%) in Q1 2026, followed by Vietnam at US$6.77 billion (15.90%) and Malaysia at US$128.89 million (0.30%).

The lopsided origin mix reflects the deep nearshoring of computer and server assembly to Mexican border-state plants, with Vietnam serving as the dominant alternative manufacturing hub for low-cost electronics assembly.

Top 5 US importing countries for HS 8471 - Automatic data processing equipment:

  1. Mexico - US$35.63 billion (83.63%): Crucial nearshoring hub for US tech hardware and secure IT supply chains.
  2. Vietnam - US$6.77 billion (15.90%): Vital low-cost manufacturing alternative to China for electronics assembly.
  3. Malaysia - US$128.89 million (0.30%): Key Southeast Asian hub for specialized electronics testing and packaging.
  4. Indonesia - US$24.77 million (0.06%): Emerging low-cost assembly node diversifying US tech hardware supply chains.
  5. India - US$20.68 million (0.05%): Growing base for US electronics manufacturing and IT hardware diversification.
Top HS Code: 8471 Importers to US Q1 2026
Rank Country Value (US$) Share % Economic Importance
1Mexico$35,625,868,86483.63%Crucial nearshoring hub for US tech hardware and secure IT supply chains.
2Vietnam$6,771,158,79215.90%Vital low-cost manufacturing alternative to China for electronics assembly.
3Malaysia$128,894,8180.30%Key Southeast Asian hub for specialized electronics testing and packaging.
4Indonesia$24,769,2310.06%Emerging low-cost assembly node diversifying US tech hardware supply chains.
5India$20,678,0170.05%Growing base for US electronics manufacturing and IT hardware diversification.
Data Source: Official TradeInt US Import Data and Bill of Lading Database
Period: January-March 2026.

Capital goods price pressure is the defining theme for the US IT hardware import segment in early 2026. BLS Import Price Index data shows nonfuel import prices rose 2.9% year-over-year through April 2026, with capital goods (the category covering computers and IT hardware) among the largest contributors to the increase.

Key market signals shaping HS 8471 US import flows:

  • Nearshoring acceleration: Manufacturing capacity continues relocating to Mexico and Southeast Asia, with Mexico's 83.63% share confirming border-state IT plants as the primary US tech hardware lane.
  • Container volume reset: Based on the National Retail Federation's Global Port Tracker, US ports handled 2.08 million TEU in January 2026 (down 6.4% YoY), with H1 2026 projected at 12.21 million TEU (down 2.5%).
TradeInt logo ✔ US Import & Export Data

💻 Access to Verified Top US HS 8471 Importers

Free trade records preview for HS 8471 (automatic data processing equipment). View verified US importers, shipment value, country of origin, and Bill of Lading detail from past trade transactions.

Access US HS 8471 past trade records

Top 2 US imports: HS 8517 - Telephones and cellular network equipment at US$39.91 billion

Provided by TradeInt's verified US shipment records, Mexico leads US imports of telephones and cellular network equipment (HS 8517) at US$3.93 billion (32.00%) in Q1 2026, followed by Vietnam at US$3.63 billion (29.55%) and India at US$2.89 billion (23.49%).

Top 5 US importing countries for HS 8517 - Telephones and cellular network equipment:

  1. Mexico - US$3.93 billion (32%): Secures rapid, tariff-free telecommunications equipment supply via USMCA nearshoring.
  2. Vietnam - US$3.63 billion (29.55%): Major global assembly hub for smartphones and consumer communication devices.
  3. India - US$2.89 billion (23.49%): Rapidly scaling smartphone manufacturing center, crucial for 'China Plus One' diversification.
  4. Viet Nam (alt entity) - US$1.25 billion (10.20%): Key partner for diversifying telecom consumer goods manufacturing.
  5. Indonesia - US$292.19 million (2.38%): Developing regional node for affordable mobile device and networking hardware.
Top HS Code: 8517 Importers to US Q1 2026
Rank Country Value (US$) Share % Economic Importance
1Mexico$3,930,944,23932.00%Secures rapid, tariff-free telecommunications equipment supply via USMCA nearshoring.
2Vietnam$3,630,197,01529.55%Major global assembly hub for smartphones and consumer communication devices.
3India$2,885,732,51623.49%Rapidly scaling smartphone manufacturing center, crucial for "China Plus One".
4Viet Nam$1,252,994,39610.20%Key partner for diversifying telecom consumer goods manufacturing.
5Indonesia$292,193,7362.38%Developing regional node for affordable mobile device and networking hardware.
Data Source: Official TradeInt US Import Data and Bill of Lading Database
Period: January-March 2026.

Smartphone import flows are entering a structurally diversified phase. According to the BLS Import Price Index April 2026 release, consumer goods import prices excluding automotives rose over the 12-month period ending April 2026, reflecting rising unit costs as production relocates into a more distributed manufacturing footprint.

Key market signals shaping HS 8517 US import flows:

  • Three-corridor manufacturing structure: Mexico, Vietnam, and India together supply 85.04% of US smartphone and cellular equipment imports, replacing the legacy single-country concentration with a balanced multi-origin base.
  • Capacity scale-up across regions: Research from McKinsey Global Institute confirms electronics production capacity is expanding across Mexico's border-state cluster, Vietnam's northern industrial corridor, and India's Tamil Nadu and Karnataka regions.

Top 3 US imports: HS 8703 - Motor vehicles at US$39.85 billion

From TradeInt's verified Q1 2026 import shipment records, Mexico anchors 99.28% of US motor vehicle imports under HS 8703 at US$8.60 billion, far ahead of Vietnam (US$59.59 million, 0.69%) and Indonesia (US$557,437, 0.01%). The near-monopoly reflects the deeply integrated USMCA automotive supply chain, where Mexican plants produce final-assembly passenger vehicles for US dealers under preferential trade terms, supported by long-established assembly clusters in Aguascalientes, Coahuila, and Nuevo León.

Top 5 US importing countries for HS 8703 - Motor vehicles:

  1. Mexico - US$8.60 billion (99.28%): Highly integrated USMCA partner driving cost-effective North American vehicle production.
  2. Vietnam - US$59.59 million (0.69%): Emerging electric vehicle (EV) and compact car manufacturing base.
  3. Indonesia - US$557,437 (0.01%): Strategic partner for future EV supply chains and affordable vehicles.
  4. India - US$497,152 (0.01%): Key supplier of cost-effective compact vehicles and emerging auto hub.
  5. Colombia - US$440,064 (0.01%): Niche regional partner providing specific vehicle models via trade agreements.
Top HS Code: 8703 Importers to US Q1 2026
Rank Country Value (US$) Share % Economic Importance
1Mexico$8,600,458,77699.28%Highly integrated USMCA partner driving cost-effective North American vehicle production.
2Vietnam$59,589,8290.69%Emerging electric vehicle (EV) and compact car manufacturing base.
3Indoneisa$557,4370.01%Strategic partner for future EV supply chains and affordable vehicles.
4India$497,1520.01%Key supplier of cost-effective compact vehicles and emerging auto hub.
5Colombia$440,0640.01%Niche regional partner providing specific vehicle models via trade agreements.
Data Source: Official TradeInt US Import Data and Bill of Lading Database
Period: January-March 2026.

Passenger vehicle prices showed a softening trend through early 2026, providing a counter-narrative to the broader capital-goods inflation pattern. The 2026 BLS Import and Export Price Indexes confirm import prices for automotive vehicles, parts, and engines declined over the 12-month period ending April 2026, reflecting improved supply chain capacity through US-Mexico border crossings.

Key market signals shaping HS 8703 US import flows:

  • USMCA-anchored dominance: Mexican passenger vehicle exports continue to dominate US dealer inventories at near-monopoly volume share, with the Aguascalientes-Coahuila-Nuevo León cluster supplying the bulk of cross-border flows.
  • March 2026 trade deficit signal: Reuters reporting on its April 29, 2026 trade deficit release highlighted the sharp month-over-month rise in US goods imports during March 2026, with passenger car flows contributing materially to the increase.
TradeInt logo ✔ Lite   ✔ Pro   ✔ Premium   ✔ Enterprise

🇺🇸 US Top Import Export Trade Statistic Overview

Learn what top imports and exports, and which top country trade partners that drive the economy of the United States by year.

Check out: United States Import Export Trade Statistic Overview

Top 4 imports in the US: HS 2709 - Petroleum crude oil at US$33.23 billion

Based on TradeInt's Q1 2026 customs data, the United States itself (re-classification trade flows) and Canada anchor crude oil imports under HS 2709, with the US recording US$21.85 billion (23.04%) and Canada US$14.03 billion (14.79%), followed by Mexico at US$12.71 billion (13.40%).

Saudi Arabia and Panama round out the top 5 with US$6.62 billion (6.98%) and US$6.07 billion (6.40%) respectively, illustrating the geographically diversified US crude oil import profile spanning North America, the Middle East, and Latin American transit corridors.

Top 5 US importing countries for HS 2709 - Petroleum crude oil:

  • United States - US$21.85 billion (23.04%): Secures domestic energy independence and stabilizes national fuel pricing.
  • Canada - US$14.03 billion (14.79%): Primary, stable overland supplier ensuring North American energy security.
  • Mexico - US$12.71 billion (13.40%): Strategic regional partner providing heavy crude essential for Gulf refineries.
  • Saudi Arabia - US$6.62 billion (6.98%): Vital global swing producer helping balance US energy markets.
  • Panama - US$6.07 billion (6.40%): Strategic transit hub and logistical node for regional oil shipments.
Top HS Code: 2709 Importers to U.S Q1 2026
Rank Country Value (US$) Share % Economic Importance
1United States$21,851,867,86823.04%Secures domestic energy independence and stabilizes national fuel pricing.
2Canada$14,031,258,81514.79%Primary, stable overland supplier ensuring North American energy security.
3Mexico$12,706,478,53613.40%Strategic regional partner providing heavy crude essential for Gulf refineries.
4Saudi Arabia$6,616,628,3156.98%Vital global swing producer helping balance US energy markets.
5Panama$6,069,670,6996.40%Strategic transit hub and logistical node for regional oil shipments.
Data Source: Official TradeInt U.S Import Data and Bill of Lading Database
Period: January-March 2026.

Crude oil prices entered 2026 under fuel-driven import price pressure. BLS import price index data shows US import prices rose 1.9% in April 2026 driven by higher fuel prices, contributing to a 12-month import price increase of 4.2% across all categories.

Key market signals shaping HS 2709 US import flows:

  • North American crude anchor: Canada and Mexico together supply 28.19% of US crude oil imports, with Canadian heavy crude feeding Midwest and Gulf Coast refineries and Mexican heavy-grade crude essential for Gulf complex blending.
  • Trade deficit signal: The Reuters March 2026 trade deficit report highlighted petroleum products as a contributing factor in the sharp month-over-month import value increase, with crude oil flows accelerating through Q1 2026.
  • Panama trans-shipment role: Panama's 6.40% share reflects its position as a key trans-shipment hub for South American and Atlantic-basin crude reaching US Gulf Coast refineries, providing supply route flexibility for US importers.
TradeInt logo ✔ Lite   ✔ Pro   ✔ Premium   ✔ Enterprise

🛢️ Preview US Crude Oil Buyers on TradeInt

TradeInt's 1SMART Search capability uncovers past trade records preview for HS 2709 (petroleum crude oil). The search result includes verified US crude oil importers, shipment value, country of origin, port detail, and Bill of Lading records.

Preview here: United Stated past transacted buyers for HS 2709 products

Top 5 US top products: HS 8473 - Parts and accessories for machines at US$31.23 billion

Sourced from TradeInt's US Import Data and Bill of Lading database, Mexico leads US imports of parts and accessories for machines (HS 8473) at US$3.35 billion (41.42%) in Q1 2026, followed by Malaysia at US$2.82 billion (34.83%) and Vietnam at US$1.84 billion (22.77%).

Top 5 US importing countries for HS 8473 - Parts and accessories for machines:

  1. Mexico - US$3.35 billion (41.42%): Essential nearshore supplier ensuring resilient North American IT manufacturing.
  2. Malaysia - US$2.82 billion (34.83%): World-leading hub for semiconductor testing and crucial computer component assembly.
  3. Vietnam - US$1.84 billion (22.77%): Critical rapidly growing supplier for specialized electronics and computer accessories.
  4. Indonesia - US$66.74 million (0.82%): Provides cost-effective component manufacturing to support broader tech supply chains.
  5. India - US$10.35 million (0.13%): Expanding base for high-tech component production and IT hardware parts.
Top HS Code: 8473 Importers to U.S Q1 2026
Rank Country Value (US$) Share % Economic Importance
1Mexico$3,351,456,57841.42%Essential nearshore supplier ensuring resilient North American IT manufacturing.
2Malaysia$2,818,789,63934.83%World-leading hub for semiconductor testing and crucial computer component assembly.
3Vietnam$1,842,555,31322.77%Critical rapidly growing supplier for specialized electronics and computer accessories.
4Indonesia$66,736,0760.82%Provides cost-effective component manufacturing to support broader tech supply chains.
5India$10,349,5100.13%Expanding base for high-tech component production and IT hardware parts.
Data Source: Official TradeInt U.S Import Data and Bill of Lading Database
Period: January-March 2026.

Semiconductor and IT component sourcing diversification is a defining theme for US importers in Q1 2026. McKinsey Global Institute's manufacturing research confirms US manufacturing reshoring and nearshoring momentum has accelerated since 2024, with electronics components and semiconductor packaging concentrated in Mexico, Malaysia, and Vietnam.

Key market signals shaping HS 8473 US import flows:

  • Triangulated supply structure: Mexico, Malaysia, and Vietnam collectively supply 99.02% of US imports under HS 8473, replacing single-country concentration with a balanced three-corridor sourcing model.
  • Capital goods pricing trend: From the BLS Import Price Index April 2026 release, capital goods import prices contributed materially to the 2.9% YoY nonfuel import price increase, with IT components reflecting the broader reshoring premium.
  • Mexico-Malaysia complementarity: Mexico handles final assembly and integration close to US end-markets while Malaysia and Vietnam dominate upstream packaging and testing, creating an efficient production-to-deployment pipeline.

Top 6 imports into the US: HS 9801 - Uncategorized goods - US$26.63 billion

Mexico dominates US imports under HS 9801 (uncategorized goods, primarily returned articles and US-origin product re-imports) at US$2.89 billion (96.53%) in Q1 2026, followed by India at US$44,177 (1.47%) and Panama at US$40,802 (1.36%), verified data from TradeInt's verified US customs records.

Top 5 US importing countries for HS 9801:

  • Mexico - US$2.89 billion (96.53%): Facilitates massive cross-border manufacturing (maquiladoras) and efficient repair/return logistics.
  • India - US$44,177 (1.47%): Supports global reverse logistics and warranty processing for US-origin goods.
  • Panama - US$40,802 (1.36%): Key free trade zone facilitating regional distribution and product returns.
  • Cameroon - US$14,036 (0.47%): Represents niche reverse logistics or equipment returns from African operations.
  • Indonesia - US$4,480 (0.15%): Supports return logistics for specific industrial goods in Southeast Asia.
Top HS Code: 9801 Importers to U.S Q1 2026
Rank Country Value (US$) Share % Economic Importance
1Mexico$2,893,09296.53%Facilitates massive cross-border manufacturing (maquiladoras) and efficient repair/return logistics.
2India$44,1771.47%Supports global reverse logistics and warranty processing for US-origin goods.
3Panama$40,8021.36%Key free trade zone facilitating regional distribution and product returns.
4Cameroon$14,0360.47%Represents niche reverse logistics or equipment returns from African operations.
5Indonesia$4,4800.15%Supports return logistics for specific industrial goods in Southeast Asia.
Data Source: Official TradeInt U.S Import Data and Bill of Lading Database
Period: January-March 2026.

Mexico's near-monopoly under HS 9801 reflects the operational depth of the US-Mexico maquiladora and IMMEX program ecosystem. BLS regional import data shows import prices from Mexico remained stable across Q1 2026, supporting the predictability that US procurement teams rely on for cross-border manufacturing partnerships.

Key market signals shaping HS 9801 US import flows:

  • Maquiladora ecosystem depth: Mexico's 96.53% share underscores the operational reliance of US manufacturers on the cross-border IMMEX manufacturing and reverse-logistics framework.
  • Stable Mexico pricing: Import prices from Mexico stayed steady across Q1 2026 per BLS regional data, reinforcing the cost predictability that makes the maquiladora model financially attractive.

Top 7 imports into the US: HS 8708 - Parts and accessories of motor vehicles - US$19.84 billion

TradeInt's Q1 2026 customs records show Mexico anchoring 93.60% of US imports of motor vehicle parts and accessories (HS 8708) at US$8.40 billion, with India a distant second at US$280.87 million (3.13%) and Vietnam third at US$202.78 million (2.26%).

The supplier concentration mirrors the HS 8703 (finished vehicles) pattern, reinforcing the deeply integrated USMCA automotive supply chain where Mexican Tier-1 and Tier-2 suppliers feed both Mexican assembly plants and US-based original equipment manufacturers.

Top 5 US importing countries for HS 8708 - Motor vehicle parts:

  • Mexico - US$8.40 billion (93.60%): Backbone of the deeply integrated North American automotive supply chain.
  • India - US$280.87 million (3.13%): Major supplier of cost-effective, high-quality aftermarket and OEM auto components.
  • Vietnam - US$202.78 million (2.26%): Fast-growing source for specialized automotive electronics and labor-intensive parts.
  • Malaysia - US$40.37 million (0.45%): Vital supplier of specialized electronic automotive components and sensors.
  • Indonesia - US$29.78 million (0.33%): Emerging regional hub for diverse automotive component manufacturing.
Top HS Code: 8708 Importers to U.S Q1 2026
Rank Country Value (US$) Share % Economic Importance
1Mexico$8,402,681,31593.60%Backbone of the deeply integrated North American automotive supply chain.
2India$280,871,6103.13%Major supplier of cost-effective, high-quality aftermarket and OEM auto components.
3Vietnam$202,784,1442.26%Fast-growing source for specialized automotive electronics and labor-intensive parts.
4Malaysia$40,366,3590.45%Vital supplier of specialized electronic automotive components and sensors.
5Indonesia$29,778,2540.33%Emerging regional hub for diverse automotive component manufacturing.
Data Source: Official TradeInt U.S Import Data and Bill of Lading Database
Period: January-March 2026.

Auto parts pricing aligned with the broader automotive sector's softening trend in Q1 2026. According to the BLS Import Price Index April 2026 release, prices for automotive vehicles, parts, and engines declined over the 12-month period ending April 2026, providing relief for US importers managing aftermarket and OEM procurement budgets.

Key market signals shaping HS 8708 US import flows:

  • USMCA-mirrored concentration: Mexico's 93.60% share in auto parts closely mirrors its 99.28% dominance in finished vehicles, confirming the deeply integrated cross-border Tier-1 and Tier-2 supplier ecosystem.
  • India and Vietnam capacity scale-up: Combined US$483.65 million volume reflects continued capacity expansion by global Tier-2 suppliers seeking diversified manufacturing footprints outside the legacy auto components base.

Top 8 imports into the US: HS 3002 - Human blood and animal blood products - US$17.57 billion

India leads US imports of human and animal blood products (HS 3002) at US$5.65 billion (57.18%) in Q1 2026, with Mexico second at US$4.14 billion (41.90%), supplied by TradeInt's US Import Data and Bill of Lading Database.

Together, the two countries supply 99.08% of US imports in this critical biopharmaceutical category, reflecting India's role as a global leader in vaccine and biological manufacturing alongside Mexico's nearshoring of medical product final-stage processing.

Top 5 US importing countries for HS 3002 - Blood products and biologicals:

  • India - US$5.65 billion (57.18%): Global leader in affordable vaccine manufacturing and critical biopharmaceutical supplies.
  • Mexico - US$4.14 billion (41.90%): Strategic nearshore partner for rapid deployment of medical/biological products.
  • Panama - US$58,832 (0.60%): Crucial regional logistics hub for distributing temperature-sensitive biologicals and vaccines.
  • Malaysia - US$10,082 (0.10%): Growing producer of specialized biological products and regional medical supplies.
  • Colombia - US$7,895 (0.08%): Emerging regional partner for specific biopharmaceutical and vaccine supply chains.
Top HS Code: 3002 Importers to U.S Q1 2026
Rank Country Value (US$) Share % Economic Importance
1India$5,648,68857.18%Global leader in affordable vaccine manufacturing and critical biopharmaceutical supplies.
2Mexico$4,138,51541.90%Strategic nearshore partner for rapid deployment of medical/biological products.
3Panama$58,8320.60%Crucial regional logistics hub for distributing temperature-sensitive biologicals and vaccines.
4Malaysia$10,0820.10%Growing producer of specialized biological products and regional medical supplies.
5Colombia$7,8950.08%Emerging regional partner for specific biopharmaceutical and vaccine supply chains.
Data Source: Official TradeInt U.S Import Data and Bill of Lading Database
Period: January-March 2026.

Biopharmaceutical import volumes carry important implications for US healthcare procurement budgets and patient access. The US Bureau of Economic Analysis March 2026 international trade release indicates pharmaceutical-related imports moved through a recalibration phase in Q1/2026, with pharmaceutical preparations showing year-over-year declines from the elevated 2025 base.

Key market signals shaping HS 3002 US import flows:

  • India's biopharma anchor role: India's 57.18% share underscores the country's positioning as the global supply hub for affordable vaccines and biopharmaceutical inputs into the US medical system.
  • Mexico nearshore complement: Mexico's 41.90% share reflects the active nearshoring of medical-product final-stage processing, supporting rapid deployment of biologicals closer to US end-markets.
TradeInt logo ✔ Lite   ✔ Pro   ✔ Premium   ✔ Enterprise

🔑 TradeInt's Latest Analysis on US Pharmaceutical Imports By Country

This TradeInt's article reveals India exported the most pharmaceuticals to the US in 2025 at US$13.39 billion, followed by Germany at US$7.83 billion and Belgium at US$5.14 billion and other in-depth US pharmaceutical import data like top categories, importers.

Read more: Which country exports the most pharmaceuticals to the US?

Top 9 imports into the US: HS 3004 - Medicines for treatment - US$16.91 billion

India dominates US imports of finished medicines (HS 3004) at US$602.57 million (73.93%) in Q1 2026, followed by Mexico at US$199.07 million (24.42%) and Malaysia at US$8.16 million (1.00%), from TradeInt global trade data on HS 3004.

Top 5 US importing countries for HS 3004 - Medicines for treatment:

  1. India - US$602.57 million (73.93%): Pharmacy of the world, providing critical, low-cost generic drugs globally.
  2. Mexico - US$199.07 million (24.42%): Essential nearshoring partner for reliable, cross-border pharmaceutical supply chains.
  3. Malaysia - US$8.16 million (1.00%): Important supplier of specific pharmaceutical treatments and specialized formulations.
  4. Bangladesh - US$3.65 million (0.45%): Rapidly expanding source of highly affordable generic medicaments and treatments.
  5. Chile - US$478,510 (0.06%): Niche supplier of specific pharmaceutical ingredients and regional medical goods.
Top HS Code: 3004 Importers to U.S Q1 2026
Rank Country Value (US$) Share % Economic Importance
1India$602,573,65173.93%"Pharmacy of the world," providing critical, low-cost generic drugs globally.
2Mexico$199,071,71124.42%Essential nearshoring partner for reliable, cross-border pharmaceutical supply chains.
3Malaysia$8,164,9501.00%Important supplier of specific medical treatments and specialized pharmaceutical formulations.
4Bangladesh$3,651,9180.45%Rapidly expanding source of highly affordable generic medicaments and treatments.
5Chile$478,5100.06%Niche supplier of specific pharmaceutical ingredients and regional medical goods.
Data Source: Official TradeInt U.S Import Data and Bill of Lading Database
Period: January-March 2026.

Indian generic medicine supply continues to anchor US pharmacy procurement through 2026. Reuters reporting on March 2026 trade data shows US pharmaceutical preparation imports declined sharply versus the 2025 peak base, but the Indian supply lane remained the structural anchor for finished-dose generics into US retail pharmacy and hospital channels.

Key market signals shaping HS 3004 US import flows:

  • Two-country concentration: India and Mexico together supply 98.35% of US imports under HS 3004, reinforcing the strategic depth of the South Asian and North American pharmaceutical supply chains.
  • Pharmacy of the World dynamic: India's 73.93% share confirms its position as the dominant global supplier of low-cost finished-dose generics, anchoring affordable retail pharmacy access across the US.
  • Volume normalization: Reuters reporting confirms the Q1 2026 pharmaceutical import decline versus the 2025 peak, signaling normalization after the unusually high 2025 baseline.

Top 10 imports into the US: HS 8542 - Integrated circuits - US$12.83 billion

From TradeInt's Q1 2026 verified US customs records, Malaysia leads US imports of integrated circuits (HS 8542) at US$521.33 million (43.84%), followed by Vietnam at US$317.51 million (26.70%) and Mexico at US$302.59 million (25.44%).

The three countries supply over 95% of US integrated circuit imports, reflecting the structural concentration of semiconductor packaging, testing, and final assembly across Southeast Asia and Mexico's growing nearshore chip integration capacity.

Top 5 source countries for HS 8542 - Integrated circuits:

  • Malaysia - US$521.33 million (43.84%): Central global hub for semiconductor packaging, assembly, and rigorous testing.
  • Vietnam - US$317.51 million (26.70%): Rapidly expanding tech hub crucial for diversifying US semiconductor supply.
  • Mexico - US$302.59 million (25.44%): Growing nearshore center for automotive and consumer electronics chip integration.
  • Philippines - US$22.14 million (1.86%): Strategic Southeast Asian partner for critical semiconductor test and assembly.
  • South Korea - US$7.36 million (0.62%): Global powerhouse providing advanced memory chips and cutting-edge semiconductor technologies.
Top HS Code: 8542 Importers to U.S Q1 2026
Rank Country Value (US$) Share % Economic Importance
1Malaysia$521,326,54943.84%Central global hub for semiconductor packaging, assembly, and rigorous testing.
2Vietnam$317,510,98726.70%Rapidly expanding tech hub crucial for diversifying US semiconductor supply.
3Mexico$302,592,96525.44%Growing nearshore center for automotive and consumer electronics chip integration.
4Philippines$22,136,4601.86%Strategic Southeast Asian partner for critical semiconductor test and assembly.
5South Korea$7,358,2440.62%Global powerhouse providing advanced memory chips and cutting-edge semiconductor technologies.
Data Source: Official TradeInt U.S Import Data and Bill of Lading Database
Period: January-March 2026.

Integrated circuit supply diversification reached operational maturity in Q1 2026. Research from McKinsey Global Institute indicates US semiconductor manufacturing reshoring momentum has been complemented by deeper Malaysian and Vietnamese packaging capacity, supporting US importer access to a more distributed chip supply base.

Key market signals shaping HS 8542 US import flows:

  • Southeast Asia packaging anchor: Malaysia and Vietnam's combined 70.54% share reflects the structural depth of Southeast Asian back-end semiconductor capacity, from wafer testing through final chip packaging.
  • Mexico nearshore integration: Mexico's 25.44% share adds the nearshore integration layer increasingly favored by US automotive and consumer electronics buyers seeking proximity-driven supply continuity.
  • South Korea advanced-tech role: South Korea's small 0.62% volume share carries outsized strategic value as the global supplier of advanced memory and cutting-edge semiconductor technologies for premium US electronics.

US import growth trends (Q1/2025 - Q1/2026)

From TradeInt's trade trends analysis capability, US imports declined 12.66% across five quarters, falling from a US$934.65 billion peak in Q1 2025 to US$816.39 billion in Q1 2026. The peak month for the period was March 2025 (inside the Q1 2025 +12.03% surge), with quarterly volumes stabilizing at a lower volume floor from Q3 2025 onward as US importers managed inventory levels carefully through ongoing trade-policy uncertainty.

US import value quarterly trends from 2025 to 2026:

  • Q1 2025: US$934.65 billion (+12.03% QoQ): Strong post-holiday inventory restocking and robust early-year consumer demand drove the period peak.
  • Q2 2025: US$772.98 billion (-17.30% QoQ): Sharp seasonal correction following the massive Q1 2025 import surge.
  • Q3 2025: US$830.51 billion (+7.44% QoQ): Steady rebound driven by early retail inventory buildup for the holidays.
  • Q4 2025: US$818.99 billion (-1.39% QoQ): Minor cooling as holiday manufacturing orders peaked earlier in Q3.
  • Q1 2026: US$816.39 billion (-0.32% QoQ): Flat import volumes reflecting cautious early-year corporate spending and inventory management.
U.S Import by Value QoQ Analysis 2025-2026
Month Import Value (US$) QoQ analysis Significant Changes
Q1 2025$934.65B12.03%Strong post-holiday inventory restocking and robust early-year consumer demand.
Q2 2025$772.98B-17.30%Sharp seasonal correction following the massive Q1 import surge.
Q3 2025$830.51B7.44%Steady rebound driven by early retail inventory buildup for the holidays.
Q4 2025$818.99B-1.39%Minor cooling as holiday manufacturing orders peaked earlier in Q3.
Q1 2026816.39B-0.32%Flat import volumes reflecting cautious early-year corporate spending and inventory management.
Data source: Official TradeInt U.S Import Data and Bill of Lading Database
Period: October 2024 - March 2026

The five-quarter trend confirms a structural reset in US import volumes after the elevated 2024-Q1 2025 inventory buildup phase.

Data from the NRF Global Port Tracker March 2026 release projects US container imports for H1 2026 at 12.21 million TEU (down 2.5% from H1 2025), with monthly volumes consistently below the 2025 baseline.

The combination of value-side stabilization at the US$816 billion quarterly level and volume-side decline at the container level indicates US importers are managing inbound flows toward higher unit-value, lower-volume sourcing patterns through 2026.

Conclusion

US top import products in Q1 2026 concentrate around IT hardware (HS 8471, 8473, 8542), telecommunications equipment (HS 8517), motor vehicles and parts (HS 8703, 8708), petroleum crude oil (HS 2709), and biopharmaceuticals (HS 3002, 3004), with Mexico anchoring seven of the top ten categories as the dominant supplier. The Q1 2026 quarterly value of US$816.39 billion confirms a stable but recalibrated US import landscape after the Q1 2025 inventory peak of US$934.65 billion.

Download US trade data samples on TradeInt including verified importer identity, shipment value, and country of origin across 10+ billion verified shipment records.

Frequently asked questions

What are the top 10 US imports?

The top 10 US imported products in Q1 2026 were HS 8471 (automatic data processing equipment, US$88.27B), HS 8517 (telephones, US$39.91B), HS 8703 (motor vehicles, US$39.85B), HS 2709 (crude oil, US$33.23B), HS 8473 (machine parts, US$31.23B), according to TradeInt's verified US import data.

What is America's #1 import?

America's #1 import in Q1 2026 was automatic data processing equipment (HS 8471) at US$88.27 billion (10.81% share), covering computers, servers, laptops, and IT hardware components, TradeInt's verified trade records indicated.

Which products do the USA import?

Based on TradeInt's US trade records, the USA imports IT hardware (HS 8471, 8473), telecommunications equipment (HS 8517), motor vehicles and parts (HS 8703, 8708), petroleum crude oil (HS 2709), biopharmaceuticals (HS 3002, 3004), integrated circuits (HS 8542), and uncategorized re-imports (HS 9801), with Mexico anchoring 7 of the top 10 supplier positions.

What are the major imports of the USA?

The USA's major imports are concentrated in capital goods, consumer electronics, and energy commodities. Based on TradeInt's Q1 2026 US trade database, automatic data processing equipment leads at US$88.27 billion, with telephones, motor vehicles, crude oil, and machine parts rounding out the top 5 categories above US$31 billion each.
Other relevant articles about Import & Export in U.S.

  1. U.S. Pharmaceutical Imports By Country 2025
  2. What are the top pharmaceuticals imported to the US?
Share the Post:

Latest Global Trade Insights

Trade Intelligence Global Pte Ltd - TradeInt - Vietnam Trade Data coverage up to 200 countries and 80 exclusive customs Vietnam Import Export

ACTIVATE YOUR FREE

ACCOUNT ACCESS

Trade Intelligence Global Pte Ltd - TradeInt - Vietnam Trade Data coverage up to 200 countries and 80 exclusive customs Vietnam Import Export

REQUEST YOUR GLOBAL INDUSTRIAL

Competitor's Data

Trade Intelligence Global Pte Ltd - TradeInt - Vietnam Trade Data coverage up to 200 countries and 80 exclusive customs Vietnam Import Export

REDEEM YOUR SPECIAL OFFER UP TO

$899!

Trade Intelligence Global

Online Payment Terms & Conditions

Payment made via online payment gateways is secured and covered by service transaction policies (e.g. PayPal’s buyer and seller protection policies).


TradeInt is classified under the intangible, virtual item or service, which is not eligible for refunds due to its nature (e.g. digital data display and downloads).


1. All TradeInt products that involve payment are of one-time transaction products that comply with the “intangible or virtual goods or services” as defined by reputable and trusted platform, such as PayPal. Payments are to be made one-time in full through payment gateways at the price set by TradeInt. No refunds shall be made once payment is done.


2. After payment is made and confirmed, access will be granted to subscriber within 24 hours. A confirmation e-mail will be sent to the subscriber which constitutes as the delivery of the subscription as well as the commencement of the subscription.


3. TradeInt will use webpage display, online communication, and other methods of communication to provide customers with the complete information to understand the product as much as possible. It is the customer’s duty to fully understand and decide the suitability of the product, and ensure that TradeInt meets their needs. If the customer has any questions and faces any major issues, the customer should communicate with TradeInt sales and customer service before the payment. TradeInt is obliged to assist the customer in responding to the problem and will proactively help to resolve related issues.

Trade Intelligence Global

Terms & Conditions

1. General:
Subscribers are granted access to and utilization of the Services exclusively for internal business operations, in accordance with the terms of the Agreement. This encompasses enabling Users to:
(a) View, copy, print, and/or download the Content within the guidelines outlined by the terms of Service/Agreement.
(b) Generate derivative works from the Content or through its utilization, and share such derivative works with Users. All Services obtained by Subscribers are provided by TradeInt or its licensors and are subject to the terms of Service/Agreement, including this Policy.
2. Changes:
Throughout the Term, TradeInt reserves the right to amend or terminate the Services, which may involve adding, removing, or modifying features or functionality, as necessary to reflect changes in applicable law, regulations, technology, or data availability. Subscriber will be informed of any significant changes affecting their access to or use of the Services or discontinuation of any Services.
3. Rights:
TradeInt hereby extends to Subscriber a revocable, non-exclusive, and non-transferable limited right to utilize the Services solely for their internal business operations during the Term, including enabling Users to:
(a) View, copy, print, and/or download the Content within the guidelines outlined by the terms of Service/Agreement.
(b) Generate derivative works from the Content or through its utilization, and share such derivative works with Users. TradeInt and its licensors retain all ownership and intellectual property rights to the Services, including any derivative works created by Subscriber, or anything developed or provided by TradeInt under the Agreement. Subscriber is not granted any intellectual property rights in the Services.
4. Limitations and Restrictions on Use:
By accessing or utilizing TradeInt’s services, you agree to adhere to the following limitations and restrictions on use. These restrictions apply to subscribers, their designated users, and any third parties accessing or utilizing TradeInt’s services.
(a) Program and Service Markings: You are prohibited from altering or removing any program or service markings, trademarks, or proprietary notices belonging to TradeInt, its affiliates, or licensors.
(b) Prohibited Activities: Users are prohibited from engaging in any automated data collection activities, including but not limited to web scraping, data mining, or the use of robots, spiders, or other automated tools, without explicit permission from the website or service provider.
(c) Intellectual Property Rights: Users acknowledge and agree that all content, including text, images, videos, and other materials, available on the website or service, is protected by copyright, trademark, and other intellectual property laws. Users may not extract, copy, or distribute this content without proper authorization.
(d) Access Restrictions: Access to certain areas of the website or service may be restricted or blocked for automated tools or excessive data requests. Users agree not to circumvent these restrictions or attempt to gain unauthorized access to restricted areas.
(e) Rate Limiting: To prevent server overload and ensure fair access for all users, the website or service may impose rate limits on data requests. Users agree to abide by these rate limits and not to exceed them through automated means.
(f) Non-Commercial Use: Licensing, selling, or otherwise making available the services to third parties for commercial exploitation is prohibited. Unless otherwise specified, automated data collection activities are strictly prohibited for any purposes. Users agree not to use automated tools to gather data without explicit permission.
(g) Indemnification: Users agree to indemnify and hold harmless the website or service provider from any damages, losses, or liabilities arising out of their unauthorized use of automated tools or violation of these terms and conditions.
(h) Modification and Reverse Engineering: You may not modify, disassemble, decompile, reverse engineer, reproduce, republish, copy, or create derivative works of any part of the infrastructure.
(i) Framing and Mirroring: “Framing” or “mirroring” of any services provided through the Internet is not permitted.
(j) Benchmarking and Testing: Benchmarking, vulnerability scanning, penetration testing, or any other form of testing of the services without explicit authorization is prohibited.
(k) Interference with Proper Operation: You may not use any device, software, or routine that could damage or interfere with the proper operation of the services.
(l) Service Operation: Inhibiting the operation of the services, engaging in denial of service attacks, or conducting search queries deemed abusive by TradeInt is prohibited.
(m) Competitive Products and Services: Developing, supporting, or assisting in the development of products or services that directly compete with TradeInt’s services is not allowed.
(n) Unlawful Use: Accessing or using the services for unlawful purposes or in a manner intended to harass or cause damage to any person or property is not permitted. Violation of these terms may result in legal action and termination of access to TradeInt services. Users are expected to adhere to these provisions to ensure lawful and respectful use of the services.
(o) Termination of Access: The website or service provider reserves the right to terminate or suspend access to users engaging in unauthorized data collection activities or violating these terms and conditions.
(p) Modification of Terms: These limitations and restrictions on data crawl and robot software usage may be modified or updated by the website or service provider at any time. Users are responsible for regularly reviewing the terms and conditions for any changes.
5. No Refund Policy:
All subscriptions and services are issued on a license basis and are non-refundable. By subscribing to or utilizing TradeInt’s services, you acknowledge and agree that no refunds will be issued for any reason, including but not limited to, unused services, partial usage, or dissatisfaction with the services.
6. Disclaimers:
TradeInt does not guarantee the availability, provision, quality, accuracy, integrity, or reliability of the services, and they are provided “as is”. TradeInt does not warrant that the services will be error-free or uninterrupted, or that they will meet subscriber’s expectations. Except as prohibited by law, TradeInt, its affiliates, and licensors disclaim all warranties.
7. Limitation of Liability:
TradeInt, its affiliates, and licensors shall not be liable for indirect, incidental, consequential, special, or exemplary damages, or any loss of revenue, profits, data, goodwill, or reputation. TradeInt’s aggregate liability under the Agreement shall not exceed the total amounts paid by the subscriber for the services during the preceding twelve (12) months.
8. Indemnification:
Subscriber agrees to defend and indemnify TradeInt against any claims arising out of or in connection with breaches of the Agreement or violations of applicable law by Subscriber or any User, materials furnished by Subscriber or any User, or disputes between Subscriber or any User.
9. Confidentiality:
Both parties agree to maintain the confidentiality of any disclosed Confidential Information and to use it solely in connection with the Agreement. Confidential Information shall not include certain information as outlined in the Agreement. The Receiver agrees to protect the Confidential Information and restrict its disclosure to authorized representatives.
10. Force Majeure:
Neither party shall be liable for failure or delay in performance due to conditions beyond its control, such as acts of God, governmental restrictions, or natural disasters. If a Force Majeure Event continues for more than thirty (30) days, either party may cancel unperformed Services.
11. Dispute Resolution:
Disputes shall be resolved through good faith negotiations between the parties, with escalation to senior officers if necessary.
12. Miscellaneous:
The Agreement may not be assigned without prior consent. The parties are independent contractors, and no partnership or agency relationship is created. Failure to enforce any provision of the Agreement shall not constitute a waiver. Each party agrees to comply with applicable laws. The Agreement constitutes the entire agreement between the parties and supersedes all prior agreements.
13. Definitions:
Various terms used in the Agreement are defined for clarity, including “Affiliate,” “Confidential Information,” “Credentials,” “Infrastructure,” “Materials,” “Representative,” “Services,” “Trademarks,” and “User.”
14. Governing Law:
Any disputes arising from the interpretation or enforcement of these terms and conditions shall be governed by the laws of the jurisdiction where the website or service provider is based.
Trade Intelligence Global

Privacy Policy

Trade Intelligence Global operates this website https://www.tradeint.com (“our Website”). We are committed to respecting and protecting your personal data collected through or in connection with our Website.


1. Introduction
We take our responsibilities under the Singapore Personal Data Protection Act 2012 seriously. We also recognize the importance of the personal data you have entrusted to us and believe that it is our responsibility to properly manage, protect and process your personal data.
This Privacy Policy is designed to assist you in understanding how we collect, use, disclose and/or process the personal data you have provided to us, as well as to assist you in making an informed decision before providing us with any of your personal data.
If you, at any time, have any queries on this policy or any other queries in relation to how we may manage, protect and/or process your personal data, please do not hesitate to contact our Data Protection Officer (the “DPO”) at the contact details below.
This Privacy Policy (together with our Website Terms of Use) sets out the basis on which we use and process any personal data we collect from you as a user of our Website. By accessing our Website, you hereby agree to be bound by the terms of this Privacy Policy.
In addition, our Website may, from time to time, contain links to and from the websites of our partner networks, advertisers, affiliates or other third parties. If you follow a link to any of these websites, please note that these websites have their own privacy policies. As these websites are not owned or operated by us, we do not accept any responsibility or liability for the contents of these websites and their privacy policies and you access and provide your personal data to these third-party websites at your own risk. Please check these policies before you submit any personal data to any such websites.
 
2. Personal data we collect
We may collect and process personal data about you such as:
(a) Personal data that you may provide when submitting or making available personal data to, our Website. This includes but is not limited to any personal data provided when you contact us through our contact page such as your name, email address and contact details.
(b) If you contact us for any reason, we may keep a record of that correspondence.
(c) Personal data that may be captured via any error logging and reporting tool that captures error report data and, at your option and with your consent, sends this data to us in order for us to be informed of any software errors or problems that may occur during your use of our Website or the services provided on it.
(d) Details of your visits to our Website, the activities you engage in when accessing our Website and the resources that you access on or via our Website.
 
3. Cookies
We use cookies on our Website. A cookie is a text file that a website transfers to your computer’s hard disk so that the website can remember who you are. Cookies only record those areas of a website that have been visited by your computer and for how long.
You have the ability to accept or decline cookies by modifying the setting in your browser. If you would like to do this, please see the help menu of your browser. However, you may not be able to use all the interactive features of our Website if cookies are disabled.
 
4. How we use your personal data
We may use your personal data that we possess for the following purposes:
(a) to process, administer and/or manage your Member account with us and contact you as may from time to time be necessary in connection with your use of our Website and/or the Services made available on it;
(b) to contact you through the contact information provided by you in order to provide you with information that you request from us;
(c) to manage and administer your use of our Website and contact you as may from time to time be necessary in connection with your use of our Website;
(d) To collect information relating to your online interactions with us (including, for example, your IP address and the pages you view) so that we can offer you a more consistent and personalized experience in your relationship with us and better serve your needs by customizing the content that we share with you;
(e) to store, host and/or back up (whether for disaster recovery or otherwise) your personal data, whether within or outside Singapore;
(f) for record-keeping purposes;
(g) to conduct research, analysis and development activities (including but not limited to data analytics, surveys and/or profiling) to improve our Website, services and facilities in order to enhance the services we provide to you, where you have consented to be contacted for such purposes;
(h) to perform credit risk, know-your-customer, anti-money laundering / countering the financing of terrorism, financial and other relevant risk assessments and checks on you;
(i) to responding to legal process, pursuing legal rights and remedies, defending litigation and managing any complaints or claims;
(j) to respond to requests for information from public and governmental / regulatory authorities, statutory boards, related companies and for audit, compliance, investigation and inspection purposes;(k) to comply with any applicable law, regulation, legal process or government request;
(l) to enforce or apply our Terms of Use and [insert name of Platform Agreement]; or
(m) to protect the rights, property or safety of any person (including for the purposes of fraud detection and prevention).
 
5. Disclosure of your information
Your personal data may be used, disclosed, maintained, accessed, processed and/or transferred to the following third parties, whether sited in Singapore or outside of Singapore (including the People’s Republic of China), for one or more of the purposes set out above:
(a) our headquarters, subsidiaries and group companies;
(b) third party service providers which require the processing of your data, for example, third party service providers which have been engaged by us to: (i) to provide and maintain any IT equipment used to store and access your personal information; (ii) to host and maintain our Website; or 
(iii) otherwise in connection with the provision of certain services provided to you on or via our Website;
(c) our auditors and legal advisors;
(d) public and governmental/regulatory authorities, statutory boards, industry associations; and /or
(e) courts and other alternative dispute forums.
In certain circumstances we may provide third parties (whether or not located in Singapore) with aggregate information about our Website’s users. This may include information about your computer, including where available your IP address, operating system and browser type, for system administration and to report aggregate information to our advertisers. This is anonymized statistical data about our users’ browsing actions and patterns, and does not identify any individual. If we are under a duty to disclose or share your personal data in order to comply with any legal obligation, or in order to enforce or apply our Website Terms of Use; or to protect the rights, property, or safety of any person (including for example for the purposes of fraud detection and prevention). Please rest assured that we never sell or rent your personal data.
 
6. Transfer of your personal data outside of Singapore
The personal data that we collect from you may be transferred to, used, processed and stored outside of Singapore for one or more of the purposes set out above. By submitting your personal data and/or using our Website, you agree and consent to such transfer, storing or processing.
We have entered into contractual undertakings to ensure that the personal data which we collect from you and transfer to our service providers (whether or not located in Singapore) is adequately protected.
We will take reasonable steps to maintain appropriate physical, technical and administrative security to help prevent loss, misuse, unauthorized access, disclosure or modification of your personal information.
 
7. Updating your information
Where you submit your personal data on our Website, you should try to ensure such personal data is accurate, and let us know if such personal data changes so that we are not holding any inaccurate personal data about you.
 
8. Your rights
You may withdraw your consent for us to collect, use, disclose and/or process your personal data for some or all of the purposes listed in this Privacy Policy.
You may request to access and/or correct the personal data currently in our possession by writing to the Data Protection Officer using the contact details provided below. Please note that we may charge you a reasonable fee for the handling and processing of your requests to access your personal data.
 
9. Changes to this Privacy Policy
We reserve the right to amend the terms of this Privacy Policy at our absolute discretion. Any amended privacy policy will be posted on our Website. You are expected to check this page from time to time to take notice of any changes we have made as they are binding on you. Your continued use of our Website and/or the services made available on or via our Website following any amendment of this Privacy Policy will signify your assent to and acceptance of its revised terms.
 
10. Further information about protection of personal data and the Singapore Personal Data Protection Act 2012
If you want to contact us with specific queries or concerns in relation to this Privacy Policy, or if you have any questions or complaints as to how your personal data is collected, used, disclosed and/or processed by us, please contact our Data Protection Officer at [email protected].