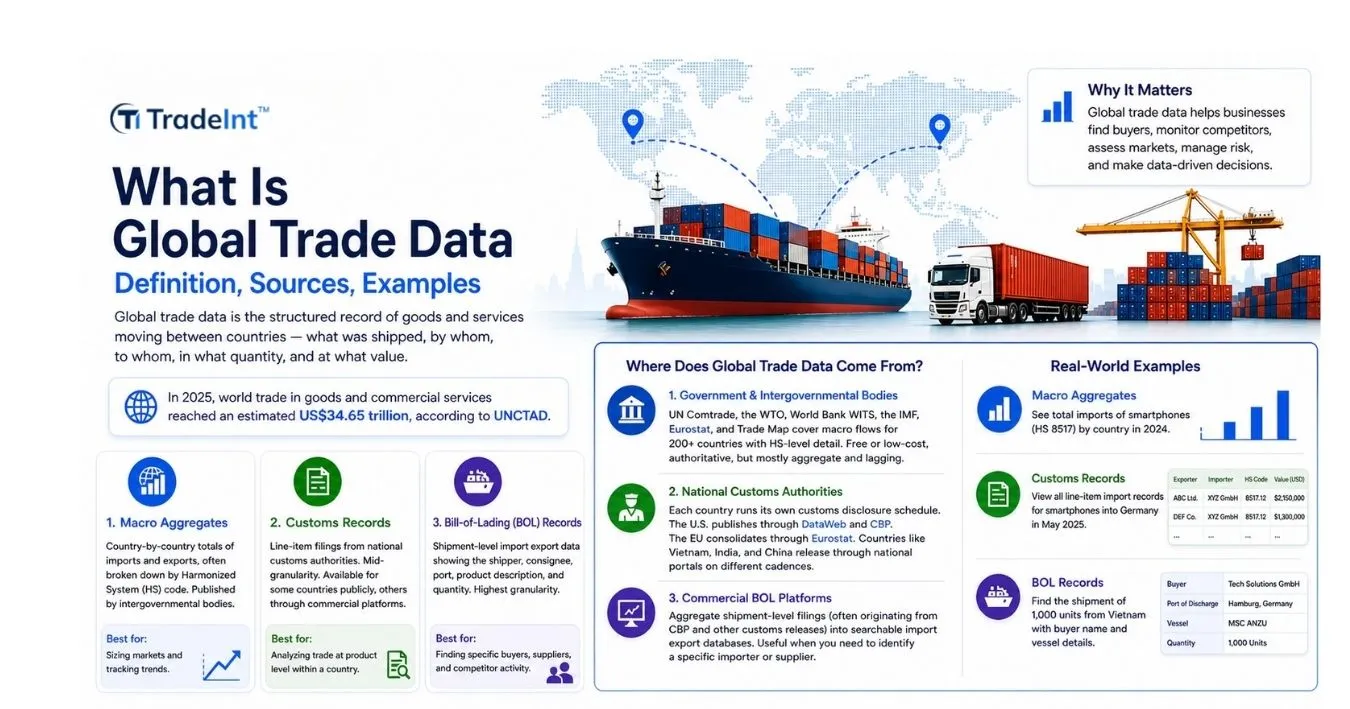
Global trade data sits in three layers, and confusing them is the most common mistake teams make.
Macro aggregates — country-by-country totals of imports and exports, often broken down by Harmonized System (HS) code. Published by intergovernmental bodies. Best for sizing markets and tracking trends.
Customs records — line-item filings from national customs authorities. Mid-granularity. Available for some countries publicly, others through commercial platforms.
Bill-of-lading (BOL) records — shipment-level import export data showing the shipper, consignee, port, product description, and quantity. Highest granularity. Best for finding specific buyers, suppliers, and competitor activity.
Global trade data is the structured record of goods and services moving between countries — what was shipped, by whom, to whom, in what quantity, at what value. In 2025, world trade in goods and commercial services reached an estimated US$34.65 trillion, according to UNCTAD. Behind that headline number sits a layered ecosystem of import export databases, customs filings, and shipment records that most teams never fully map. This guide walks through the layers, the sources, and a decision framework for choosing the right one for your question.
A second nuance: "global" rarely means every country. Coverage depth depends on each country's customs disclosure policy and privacy law. Some countries publish near-monthly; others lag six months or more; some don't publish firm-level data at all.
TradeInt is a global trade data platform providing access to over 10 billion verified import and export records. Its coverage spans over 200 countries and more than 80 customs data sources.
This article provides an overview of global trade data and its sources. Use TradeInt to explore more detailed trade records and continue tracking this market as new data becomes available. Search global trade records →
There are three categories of sources. Each answers different questions.
Government and intergovernmental bodies.UN Comtrade, the WTO, World Bank WITS, the IMF, Eurostat, and Trade Map cover macro flows for 200+ countries with HS-level detail. Free or low-cost, authoritative, but mostly aggregate and lagging.
National customs authorities. Each country runs its own customs disclosure schedule. The U.S. published through DataWeb and CBP. The EU consolidates through Eurostat. Vietnam, India, China, and others release through national portals on different cadences.
Commercial bill-of-lading platforms. Aggregate shipment-level filings (often originating from CBP and other customs releases) into searchable import export databases. Useful when you need to identify a specific importer or supplier, questions that the macro layer cannot answer.
"How big is the market for product X in country Y?"
Macro
UN Comtrade, Trade Map, WITS
"Which companies are importing product X into country Y?"
Bill-of-lading
Commercial trade-data platforms
"How are tariffs and policies affecting flows?"
IGO + customs
WTO, WITS, national customs
"Who is my competitor selling to?"
Bill-of-lading
Commercial trade-data platforms
"Is this supplier real, and how active are they?"
Bill-of-lading
Commercial trade-data platforms
The wrong layer wastes hours. Macro import export data will never tell you who shipped 12 containers of arabica beans to Ho Chi Minh City last month. Bill-of-lading data will never give you a clean five-year tariff trend.
For a broader, data-backed comparison, explore our in-depth guide to the world’s top trade intelligence platforms, including UN Comtrade, ITC Trade Map, and World Integrated Trade Solution (WITS), which collectively aggregate millions of official customs records and global trade statistics to support accurate market analysis and sourcing decisions.
Three details quietly decide whether the global trade data is usable.
HS codes. The Harmonized System is a six-digit international product classification (extended to 8–10 digits at the country level). HS 0901 is coffee; 0901.21 is roasted coffee, not decaffeinated; 0901.21.0010 (in the U.S. tariff schedule) is a finer cut. Knowing the right code is half the job.
Freshness. "Monthly" is the gold standard for customs and shipment data; quarterly and annual are typical for macro aggregates. Country-level differences can be six months or more. Always check the trade data release schedule before drawing trend lines.
Country Trade Data Coverage. "200+ countries" is a marketing line, not a quality metric. Trade data depth refers to how many years, how granular per country, whether firm names are present, and whether they ask any vendor.
Say you sell green coffee and want a list of active Vietnamese buyers.
Pick the layer. You need importer names, which should come from a bill of lading. Macro sources won't help.
Pull the records. Filter by HS 0901 (coffee, not roasted) and destination Vietnam over the last 12 months. Capture importer name, shipment count, and origin port.
Validate. Cross-check the macro picture in Trade Map or UN Comtrade: does Vietnam's reported coffee import volume align with the shipment-level totals? If not, investigate whether you're missing a port or HS sub-code.
Act. Rank importers by frequency and recent activity, qualify with company background, and contact the top 10–20.
Self-reporting gaps. Country A's exports to Country B and Country B's imports from Country A often don't match. The gap is normal, not a bug; it reflects different valuation methods (FOB vs. CIF) and reporting lags.
Shipment value vs. goods value. A bill-of-lading value can include freight and insurance; a customs valuation may not. Don't compare them as if they're the same number.
The "billions of records" trap. Record count is not coverage. A platform with 5B records might still be missing the country or HS chapter you care about. Always test with your own use case with a free trial before subscribing.
TradeInt is an AI-powered global trade intelligence platform that aggregates customs records, shipping data, and verified company profiles across 200+ countries, with full or partial customs data for 90+ of those countries. The platform is designed for non-technical users who need to find buyers, evaluate markets, and monitor competitor activity without a data analyst background. Coverage and data-type detail vary by country and subscription tier. See the live coverage matrix offered by official TradeInt here:TradeInt 200+ Global Country Trade Data Coverage
To see how TradeInt transforms raw global trade data into actionable import export insights, explore our full platform overview and discover how businesses leverage verified trade data for smarter sourcing and market expansion.
Customs data covers product, HS code, value, and quantity declared to a customs authority. Shipping data covers the logistics layer: vessels, routes, ports, and container details. Bill-of-lading trade records typically contain both.
A bill of lading is the carrier's receipt for goods being shipped. When customs authorities (notably U.S. CBP) release these filings, they become a primary source for shipment-level import export data, including importer and exporter names.
Macro aggregates from IGOs typically lag by one to six months. Customs records range from weekly (U.S.) to monthly (most countries) to multi-month delays. Real-time global trade data does not exist at scale; "near real-time" usually means a few days behind for select countries.
Need the latest country trade data for your business needs? Contact our trade specialist to get a free consultation.
Around 200 countries report some form of macro trade data to UN Comtrade and the WTO. Roughly 90 countries release granular customs or bill-of-lading data accessible through commercial platforms; the rest restrict firm-level data due to privacy or regulatory policy.
It depends on the use case. For market sizing and trend analysis, IGO macro sources (UN Comtrade, WTO, Trade Map) are authoritative and free. For finding buyers, suppliers, or tracking competitors, bill-of-lading platforms are the right layer. For policy and tariff analysis, WITS combined with national customs is hard to beat. There is no single best source, only the right source for the question.
Over the course of my career in supply chain management, I have observed a consistent pattern: by the time a shortage or disruption reaches the headlines, the underlying sourcing shift has typically been developing for 12 to 18 months.
TradeInt is one of the largest import export database, hitting 8 Billion records in 2025 (increased 3 Billion since 2020). Optimize your supply chain today.
What is TradeInt? Learn how the platform works, its core platform comparison & features, pricing plans, and real-world use cases across global trade industries.
Top 10 largest exporting countries 2025, ranked by export value & top trade partners. China leads at $3.41T, followed by South Africa $1.92T & the U.S. $1.61T.
Trade Intelligence Global launches TradeInt, an online trade database platform offering over 10 billion detailed import/export data & bill of lading as of 2026.