Table of Contents
Introduction
Overview of Indonesia's Trade
Economic Context
Trade Balance
Key Exports

- Mineral Fuels, Mineral Oils, and Their Distillation Products (HS Code 27)
- Animal and Vegetable Oils, Fats, and Their Decomposition Products (HS Code 15)
- Steel (HS Code 72)
- Electrical Machinery and Equipment (HS Code 85)
- Vehicles and Their Parts (HS Code 87)
- Ore, Slag, and Ash (HS Code 26)
- Precious Metals and Stones (HS Code 71)
- Nickel and Its Products (HS Code 75)
- Machinery and Mechanical Appliances (HS Code 84)
- Footwear (HS Code 64)
Export Destinations
- China
- United States
- Japan
- India
- Singapore
- Malaysia
- Philippines
- South Korea
- Vietnam
- Thailand
- Taiwan
- Netherlands
- Bangladesh
- Australia
- Pakistan
Indonesia Export HS 2-Digit 2023 Analysis
| # | HS CODE | Value (US$) | Value Proportion | Quantity | Quantity Proportion | Average Price (US$) |
|---|---|---|---|---|---|---|
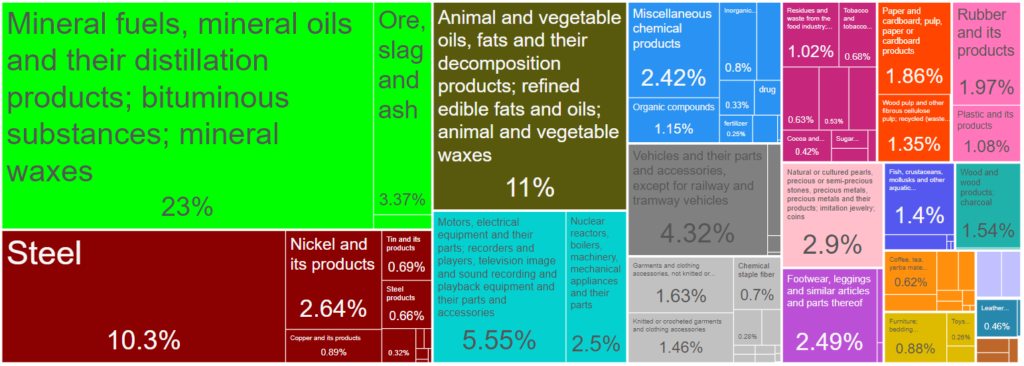
| 1 | 27 ( Mineral fuels, mineral oils and their distillation products; bituminous substances; mineral waxes ) | 59,494,673,227.15 | 23.02% | 397,111,154,658.69 | 78.12% | 0.15 |
| 2 | 15 ( Animal and vegetable oils, fats and their decomposition products; refined edible fats and oils; animal and vegetable waxes ) | 28,453,392,390.61 | 11.01% | 24,190,192,332.89 | 4.76% | 1.18 |
| 3 | 72 ( Steel ) | 26,704,566,922.18 | 10.33% | 12,860,043,269.79 | 2.53% | 2.08 |
| 4 | 85 ( Motors, electrical equipment and their parts; recorders and players, television image and sound recording and playback equipment and their parts and accessories ) | 14,331,979,449.31 | 5.55% | 400,078,217.93 | 0.08% | 35.82 |
| 5 | 87 ( Vehicles and their parts and accessories, except for railway and tramway vehicles ) | 11,152,847,224.64 | 4.32% | 1,396,780,064.41 | 0.27% | 7.98 |
| 6 | 26 ( Ore, slag and ash ) | 8,720,888,310.04 | 3.37% | 5,618,433,758.57 | 1.11% | 1.55 |
| 7 | 71 ( Natural or cultured pearls, precious or semi-precious stones, precious metals, precious metals and their products; imitation jewelry; coins ) | 7,505,564,379.95 | 2.90% | 2,763,105.06 | 0.00% | 2716.35 |
| 8 | 75 ( Nickel and its products ) | 6,815,596,838.05 | 2.64% | 823,789,711.16 | 0.16% | 8.27 |
| 9 | 84 ( Nuclear reactors, boilers, machinery, mechanical appliances and their parts ) | 6,460,189,267.42 | 2.50% | 507,673,613.85 | 0.10% | 12.73 |
| 10 | 64 ( Footwear, leggings and similar articles and parts thereof ) | 6,438,554,647.31 | 2.49% | 226,051,251.43 | 0.04% | 28.48 |
| 11 | 38 ( Miscellaneous chemical products ) | 6,253,822,495.75 | 2.42% | 4,614,592,396.57 | 0.91% | 1.36 |
| 12 | 40 ( Rubber and its products ) | 5,096,310,689.19 | 1.97% | 1,857,678,373.61 | 0.37% | 2.74 |
| 13 | 48 ( Paper and cardboard; pulp, paper or cardboard products ) | 4,794,003,838.86 | 1.86% | 4,250,613,484.02 | 0.84% | 1.13 |
| 14 | 62 ( Garments and clothing accessories, not knitted or crocheted ) | 4,219,247,312.44 | 1.63% | 120,784,982.22 | 0.02% | 34.93 |
| 15 | 44 ( Wood and wood products; charcoal ) | 3,985,017,370.95 | 1.54% | 4,777,837,658.28 | 0.94% | 0.83 |
Key Imports

Major Import Products
- Mineral Fuels, Mineral Oils, and Their Distillation Products (HS Code 27)
- Machinery and Mechanical Appliances (HS Code 84)
- Electrical Machinery and Equipment (HS Code 85)
- Steel (HS Code 72)
- Vehicles and Their Parts (HS Code 87)
- Plastics and Articles Thereof (HS Code 39)
- Organic Chemicals (HS Code 29)
- Cereals (HS Code 10)
- Steel Products (HS Code 73)
- Residues and Waste from the Food Industry (HS Code 23)
- Optical, Photographic, and Precision Instruments (HS Code 90)
- Sugar and Confectionery (HS Code 17)
- Miscellaneous Chemical Products (HS Code 38)
- Precious Metals and Stones (HS Code 71)
- Rubber and Articles Thereof (HS Code 40)
Import Sources
- China
- Singapore
- Japan
- United States
- Malaysia
- South Korea
- Thailand
- Australia
- India
- Vietnam
- Brazil
- Germany
- Saudi Arabia
- Nigeria
- Taiwan
Indonesia Import HS 2-Digit 2023 Analysis
| # | HS Code | Value (US$) | Value Proportion | Quantity | Quantity Proportion | Average Price (US$) |
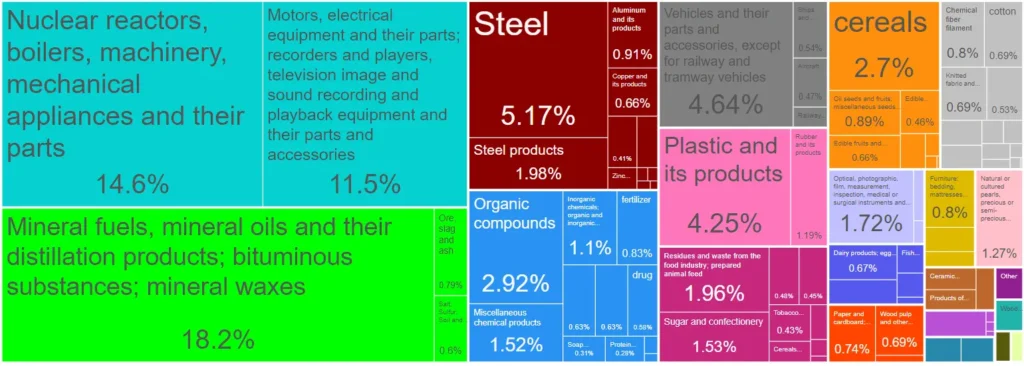
| 1 | 27 ( Mineral fuels, mineral oils and their distillation products; bituminous substances; mineral waxes ) | 40,120,392,618 | 18.15% | 49,394,554,165 | 34.48% | 0.81 |
| 2 | 84 ( Nuclear reactors, boilers, machinery, mechanical appliances and their parts ) | 32,154,880,863 | 14.55% | 3,038,208,673 | 2.12% | 10.58 |
| 3 | 85 ( Motors, electrical equipment and their parts; recorders and players, television image and sound recording and playback equipment and their parts and accessories ) | 25,223,707,617 | 11.41% | 1,091,301,634 | 0.76% | 23.11 |
| 4 | 72 ( Steel ) | 11,381,141,543 | 5.15% | 10,158,600,319 | 7.09% | 1.12 |
| 5 | 87 ( Vehicles and their parts and accessories, except for railway and tramway vehicles ) | 10,199,905,491 | 4.61% | 998,347,743 | 0.70% | 10.22 |
| 6 | 39 ( Plastic and its products ) | 9,345,017,156 | 4.23% | 4,012,694,138 | 2.80% | 2.33 |
| 7 | 29 ( Organic compounds ) | 6,420,905,988 | 2.90% | 3,763,262,251 | 2.63% | 1.71 |
| 8 | 10 ( cereals ) | 5,950,499,485 | 2.69% | 10,415,082,202 | 7.27% | 0.57 |
| 9 | 73 ( Steel products ) | 4,348,916,242 | 1.97% | 1,420,377,514 | 0.99% | 3.06 |
| 10 | 23 ( Residues and waste from the food industry; prepared animal feed ) | 4,312,108,977 | 1.95% | 5,615,051,544 | 3.92% | 0.77 |
| 11 | 90 ( Optical, photographic, film, measurement, inspection, medical or surgical instruments and equipment, precision instruments and equipment; parts and accessories of the above items ) | 3,793,045,744 | 1.72% | 94,694,794 | 0.07% | 40.06 |
| 12 | 17 ( Sugar and confectionery ) | 3,361,090,169 | 1.52% | 4,133,135,113 | 2.89% | 0.81 |
| 13 | 38 ( Miscellaneous chemical products ) | 3,336,011,462 | 1.51% | 1,285,930,154 | 0.90% | 2.59 |
| 14 | 71 ( Natural or cultured pearls, precious or semi-precious stones, precious metals, precious metals and their products; imitation jewelry; coins ) | 2,795,838,996 | 1.26% | 3,890,639 | 0.00% | 718.61 |
| 15 | 40 ( Rubber and its products ) | 2,608,548,740 | 1.18% | 628,518,379 | 0.44% | 4.15 |
Trade Partners
Top Trading Partners
ASEAN
- Singapore: A major hub for Indonesia’s refined petroleum products, machinery, and electronics.
- Malaysia: Significant for both exports and imports, particularly in refined petroleum and machinery.
- Thailand: Major trading partner in vehicles, machinery, and food products.
- Vietnam: Growing trade partner, particularly in machinery and electronics.
China
- Export Value: $62.1 billion (24.03% of total exports)
- Import Value: $61.6 billion (27.85% of total imports)
- Key Products: Machinery, electronics, and consumer goods from China, and mineral fuels, animal and vegetable oils, and steel to China.
United States
- Export Value: $22.2 billion (8.58% of total exports)
- Import Value: $11.2 billion (5.08% of total imports)
- Key Products: Electrical machinery, textiles, and footwear to the US, and machinery, agricultural products, and aircraft from the US.
European Union
- Netherlands: Major gateway for Indonesian products in Europe.
- Germany: Significant for machinery and chemicals.
Trade Agreements
ASEAN Free Trade Area (AFTA)
- Impact: AFTA has eliminated tariffs on most goods traded between ASEAN member states, fostering greater economic integration and boosting intra-ASEAN trade.
Regional Comprehensive Economic Partnership (RCEP)
- Impact: RCEP, which includes ASEAN countries, China, Japan, South Korea, Australia, and New Zealand, aims to create the world’s largest trading bloc. It is expected to lower tariffs, enhance market access, and streamline trade procedures.
Indonesia-Australia Comprehensive Economic Partnership Agreement (IA-CEPA)
- Impact: IA-CEPA enhances trade and investment flows between Indonesia and Australia, providing better access to each other’s markets, particularly in agriculture, education, and mining.
Indonesia-European Free Trade Association Comprehensive Economic Partnership Agreement (IE-CEPA)
- Impact: IE-CEPA aims to boost trade and investment between Indonesia and EFTA states (Switzerland, Norway, Iceland, and Liechtenstein). It includes provisions on goods, services, investment, intellectual property, and sustainable development.
Indonesia-Chile Comprehensive Economic Partnership Agreement (IC-CEPA)
- Impact: This agreement improves market access for Indonesian goods in Chile, especially palm oil, automotive products, and textiles, and vice versa for Chilean goods in Indonesia.
Recent Trends and Developments
Growth Sectors
- Growth: Indonesia has seen a significant uptick in the export of electronic goods and electrical equipment.
- Growth: The steel industry has shown strong growth due to rising global demand.
- Growth: Indonesia’s agricultural exports, particularly animal and vegetable oils and fats, have increased.
Declining Sectors
- Decline: While still significant, the textile and footwear sector has faced stiff competition and supply chain disruptions.
- Decline: Exports of rubber and paper products have declined slightly due to changing global demands and environmental concerns.
Trade Policies
- Description: Enacted to improve the business climate and attract foreign investment.
- Impact: Simplifies regulations and eases restrictions on foreign ownership, aiming to boost trade and investment.
- Description: Policies aimed at reducing dependence on imported goods, especially in the automotive and electronics sectors.
- Impact: Encourages local manufacturing, though it has faced criticism for potentially increasing production costs and reducing competitiveness.
- Description: Agreements focused on enhancing digital trade, such as the Digital Economy Partnership Agreement (DEPA) with Singapore, Chile, and New Zealand.
- Impact: Promotes e-commerce, data flow, and digital services trade, positioning Indonesia as a hub for digital trade in Southeast Asia.
Impact of Global Events
- Initial Impact: Significant disruptions to supply chains, reduced demand for non-essential goods, and decreased manufacturing output.
- Recovery: Rapid recovery in export sectors such as electronics, agricultural products, and mining, driven by global economic recovery and increased demand.
- Impact: Created opportunities for Indonesian exporters to fill the gap left by tariffs on Chinese goods in the US market.
- Shift in Trade Dynamics: Indonesia benefited from diverted trade flows and increased demand for alternative suppliers.
- Impact: Fluctuations in global oil prices have affected Indonesia’s trade balance, particularly in the import and export of mineral fuels.
- Adaptation: Indonesia has increased its focus on renewable energy sources and biofuels to mitigate the impact of oil price volatility.
Conclusion
Challenges and Opportunities
Challenges
- Tariffs and Quotas: Indonesia faces high tariffs and quotas in some of its key export markets, which can limit the competitiveness of its products. For example, agricultural exports often encounter restrictive tariffs in the EU and US.
- Non-Tariff Barriers: Standards and regulatory requirements in foreign markets can be stringent, creating hurdles for Indonesian exporters, particularly small and medium enterprises (SMEs) that may lack the resources to comply with these regulations.
- Logistics and Transport: Indonesia’s archipelagic geography poses significant logistical challenges. Inadequate infrastructure, such as poor road networks and underdeveloped ports, can increase transportation costs and lead to delays in the supply chain.
- Energy Supply: Inconsistent and insufficient energy supply can disrupt manufacturing and industrial activities, affecting the overall productivity and reliability of Indonesian exports.
- Regional Competitors: Indonesia faces stiff competition from neighboring countries like Vietnam, Thailand, and Malaysia, which often have more advanced manufacturing capabilities and better trade agreements.
- Global Market Dynamics: The global market is highly competitive, and Indonesia must continuously innovate and improve its products and processes to maintain and enhance its market share.
- Complex Regulations: The regulatory environment in Indonesia can be complex and cumbersome, with overlapping jurisdictions and frequent changes in policies, making it difficult for businesses to navigate.
- Corruption: Corruption remains a challenge, with businesses sometimes facing additional unofficial costs and bureaucratic delays.
Opportunities
- Africa: Growing economic development in African countries presents new opportunities for Indonesian exports, particularly in sectors like machinery, textiles, and food products.
- Middle East: Increased demand for food and consumer goods in the Middle East provides a lucrative market for Indonesian agricultural and processed food products.
- Digital Economy: The rapid growth of the digital economy in Indonesia offers significant potential. E-commerce, fintech, and digital services are booming, driven by a young, tech-savvy population and increased internet penetration.
- Renewable Energy: Indonesia has vast potential for renewable energy, particularly solar, wind, and geothermal. Investment in these sectors can not only meet domestic energy needs but also create opportunities for technology exports and partnerships.
- Upgrading Industry: Moving up the value chain in manufacturing, such as producing higher-value electronics, machinery, and automotive parts, can enhance Indonesia’s competitiveness and reduce reliance on raw material exports.
- Innovation and R&D: Investing in research and development can lead to innovation in products and processes, opening up new markets and increasing the value of Indonesian exports.
- Comprehensive Agreements: Expanding and deepening trade agreements with key partners can improve market access and reduce trade barriers. Participation in agreements like RCEP and pursuing new deals with other regions can significantly boost trade.
- Bilateral and Multilateral Cooperation: Strengthening bilateral ties with major economies and participating in multilateral organizations can help Indonesia negotiate better terms and foster a more favorable trade environment.
- Green Products: As global demand for sustainable and environmentally friendly products rises, Indonesia can capitalize on this trend by promoting its eco-friendly agricultural products, sustainable palm oil, and green technology solutions.
- Circular Economy: Adopting circular economy principles can improve resource efficiency, reduce waste, and create new business opportunities in recycling and sustainable manufacturing.
Conclusion
Conclusion
Summary
Future Outlook
If you’re interested in exploring more about Indonesia’s trade data, you can visit the following links:
These links provide valuable insights into Indonesia’s export and import trends, helping you understand the country’s trade dynamics in depth.
Learn more about
Indonesia Trade Coverage
To learn more about the topics discussed in this blog post, you can explore the following additional resources:
- Unveiling the Superiority of TradeInt over Panjiva: A Comprehensive Comparison
- Unveiling the Superiority of TradeInt over MarketInsideData: A Comprehensive Comparison
- Unveiling the Superiority of TradeInt over TenData: A Comprehensive Comparison
- What is Trade Data? Understanding Import and Export Data
- Unlocking Trade Insights with Mirror Data
- Understanding the Legality of Trade Data Platforms
- Trade Data Confidentiality: Understanding TradeInt’s Approach
- Understanding Trade Data Discrepancy: Causes and Implications
- TradeInt Online Trade Database Platform Release
- Trade Intelligence Global Pte Ltd: Innovative Global Trade Services
- Navigating the World of Customs Data: A Comprehensive Guide
About Trade Intelligence Global Pte. Ltd.
Trade Intelligence is a distinguished leader in global trade solutions, delivering exceptional results for businesses worldwide. With a focus on excellence, innovation, and client success, Trade Intelligence Global empowers businesses to thrive in today’s interconnected global economy. To find out more, visit https://tradeint.com.
FAQ
Indonesia’s major exports include mineral fuels, oils, electrical machinery, textiles, and agricultural products like palm oil.
China, the United States, Japan, and Singapore are among Indonesia’s largest trading partners, facilitating significant export and import activities.
Challenges include high tariffs in key export markets, infrastructure deficiencies, regulatory complexities, and stiff competition from neighboring countries.
The pandemic initially disrupted supply chains and reduced global demand, but Indonesia saw recovery in sectors like electronics and agriculture as global markets stabilized.
Trade agreements, such as ASEAN agreements and bilateral deals with major economies, help Indonesia access markets with reduced tariffs and streamlined trade regulations.
Trade agreements, such as ASEAN agreements and bilateral deals with major economies, help Indonesia access markets with reduced tariffs and streamlined trade regulations.
Policies like the Omnibus Law on Job Creation aim to simplify regulations and attract foreign investment, potentially boosting trade and economic growth.
Indonesia’s strategic location in Southeast Asia positions it as a gateway to both ASEAN markets and global trade routes, enhancing its trade potential.
Resources like Trade International provide comprehensive data on Indonesia’s export-import trends, offering insights into historical data, current statistics, and data coverage across various sectors.
Emerging markets in Africa and the Middle East present opportunities for Indonesian exports, especially in sectors like renewable energy and digital services.


