Key takeaways about top rice importers in the USA 2025 to 2026
- DAESANG AMERICA INC leads importers of rice in the USA in Q1 2026 at US$170.99 million (16.04% share of HS 1006), followed by MAPEI CARIBE INC GUAYNABO (11.03%), AMERICAN COMMERCIAL TRANSPORT INC (2.66%), ALGRO INTERNATIONAL LLC (1.77%), and SODO INTERNATIONAL CORP (1.55%).
- US rice imports hit a record-high 49.7 million cwt in 2025/26, reported by USDA Rice Outlook February 2026, with long-grain rice at a record 43.0 million cwt and US domestic rice production declining 3.5% YoY to 214.4 million cwt.
- South Korea, Dominican Republic, and Thailand anchor 54.68% of US rice imports in Q1 2026 at a combined US$582.97 million, with China and India supplying basmati, jasmine, and bulk volume to round out the top 5 origin block.
Who imports rice to the USA? Top rice buyers in the USA
The top US rice buyers in Q1 2026 are DAESANG AMERICA INC at US$170.99 million (16.04% share), MAPEI CARIBE INC GUAYNABO at US$117.61 million (11.03%), AMERICAN COMMERCIAL TRANSPORT INC at US$28.33 million (2.66%), ALGRO INTERNATIONAL LLC at US$18.91 million (1.77%), and SODO INTERNATIONAL CORP at US$16.54 million (1.55%). The top 5 verified rice buyers on TradeInt collectively command 33.05% of Q1 2026 imports under HS 1006.
Top 5 importers of rice in the USA in Q1 2026:
- DAESANG AMERICA INC: Imports authentic Asian and Korean food products to meet diverse consumer demand.
- MAPEI CARIBE INC GUAYNABO: Imports specialized agricultural or industrial ingredients, serving regional supply chains in the Caribbean.
- AMERICAN COMMERCIAL TRANSPORT INC: Manages international bulk shipping and logistics for large-scale agricultural commodities.
- ALGRO INTERNATIONAL LLC: Supplies premium, organic, and shelf-stable specialized rice varieties across North America.
- SODO INTERNATIONAL CORP: Distributes traditional Asian food commodities and ethnic staples to regional markets.

TradeInt is a global trade data platform providing access to over 10 billion verified import and export records. Its coverage spans over 200 countries and more than 80 customs data sources.
This article provides an overview of rice imports and buyers in the US. Use TradeInt to explore more detailed trade records and continue tracking this market as new data becomes available. Search US rice import records →
📊 Preview of HS 1006 US Import Data on TradeInt Trade Record Database
Filter every US$1.07 billion in Q1 2026 US rice imports (HS 1006) by importer, origin country, port, and shipment date. The summary covers over billions of BoL records and top US rice buyers available across HS 1006 trade lanes.
Preview now: US past HS 1006 import records
USA rice import market in 2025 - 2026
The US rice import market entered a record-volume phase through the 2025/26 marketing year, driven by reduced domestic production, sustained consumer demand for specialty rice varieties, and structural import growth across long-grain categories.
According to the USDA Economic Research Service Rice Outlook February 2026 (RCS-26B), total US 2025/26 rice imports are forecast at 49.7 million hundredweight (cwt), still nearly 1% above a year earlier and the highest on record, with long-grain rice accounting for 43.0 million cwt of the total.
Production and supply chain of US rice imports breakdown
Key market dynamics shaping US rice buyers and US rice imports in 2025-2026:
- Record US rice import volumes: US 2025/26 imports reached a record-high 49.7 million cwt per USDA's February 2026 outlook, with long-grain (43.0 million cwt) hitting its own record and broken kernels imports rising to offset reduced domestic millings.
- Domestic production decline: US 2025/26 rice production is forecast at 214.4 million cwt, down 3.5% YoY, with long-grain output reductions creating import demand for replacement supply across food manufacturers.
- Farm price compression: US all-rice 2025/26 season-average farm price is projected at US$13.20/cwt, the lowest since 2018/19, reflecting abundant global supplies and the record-large carry-in inventory entering the cycle.
- 2026/27 outlook tightens: Total US rice supply is forecast to be down 10% to 275.3 million cwt for 2026/27 on sharply lower long-grain production, with imports holding at 45.8 million cwt.
✔ Lite ✔ Pro ✔ Premium ✔ EnterpriseTradeInt is a global trade data platform covering 200+ countries and 80+ customs sources. Learn about TradeInt →
🚢 Prospect Buyers-Suppliers Worldwide with TradeInt's Global Prospect Discovery
Surface port-level US rice import flows, shipment volumes, pricing benchmarks, and trade concentration patterns. TradeInt's logistics data intelligence equips rice suppliers, traders, and brokers to map active US rice buyer networks across global routes.
Explore deeper: TradeInt's logistics market data intelligence SaaS feature
Regulatory framework and consumer demand for US rice buyers
US rice imports operate under USDA Agricultural Marketing Service oversight and FDA Food Safety Modernization Act (FSMA) compliance requirements.
FDA prior notice is mandatory for all rice shipments entering US ports, and importers are responsible for verifying foreign supplier food safety practices through documented supplier verification programs. Meanwhile, USDA's Animal and Plant Health Inspection Service additionally inspects rice imports for noxious weed seeds and quarantine pests.
On the demand side, US consumer preferences continue to favor aromatic and specialty rice varieties including jasmine rice, basmati rice, and short-grain Asian-style rice for sushi and Korean cuisine.
Mordor Intelligence's US rice market analysis indicated that the broader US rice market continues to expand on ethnic cuisine adoption, retail grocery diversification, and the integration of medium-grain and short-grain varieties into restaurant menus and ready-meal manufacturing.
Rice wholesalers US supply-chain shifts and price benchmarks
US rice import supply-chain trends from 2025-2026:
- Rice wholesalers US sourcing diversification: Major rice wholesalers US-side are expanding origin mixes beyond traditional Thailand and Vietnam supply lanes, with South Korea, China, and the Dominican Republic playing larger roles in 2025-2026 volume flow.
- Long-grain replacement imports: Reduced US domestic millings drove a surge in broken kernel imports for industrial food manufacturers, with US long-grain millers absorbing more imported supply for retail and food service end-users.
- Global price softening: Global rice trading prices fell across most of Asia and South America through 2025, mostly due to weaker demand and abundant supplies, supporting US import economics for commercial rice wholesalers on the US side.
- Record global trade: Global rice trade in calendar year 2026 is projected at a record 62.1 million tons (milled basis), with India accounting for 25.0 million tons of exports - the largest rice export volume from any single country.
✔ Lite ✔ Pro ✔ Premium ✔ EnterpriseTradeInt is a global trade data platform covering 200+ countries and 80+ customs sources. Learn about TradeInt →
🌎 Uncover 2025 US Import Market Analysis, Data Powered By TradeInt
The top 4-digit HS code in 2025 US imports was 8471 (automatic data processing machines), with 847150 valued at US$163.64B (4.87%). See the full HS chapter and country-level analysis on TradeInt's insights blog.
Read more: US Import Data Analysis 2025
What are the common imported rice types in the US?
The top imported rice types in the US are HS 100600 (rice, unspecified) at US$739.12 million (69.32%), HS 100610 (rice in the husk, paddy) at US$129.11 million (12.11%), and HS 100630 (semi-milled and wholly milled rice) at US$113.51 million (10.65%), with HS 100620 (husked/brown rice) at US$29.18 million (2.74%), data source from TradeInt's HS 1006 US import.
Top 6-digit HS 1006 categories imported to the USA in Q1 2026:
- HS 100600 - Rice (unspecified): US$739.12 million (69.32%): Drives the majority of market volume, stabilizing standard food manufacturing and consumer supplies.
- HS 100610 - Rice in the husk (paddy): US$129.11 million (12.11%): Supports domestic rice mills by providing raw materials for local refining.
- HS 100630 - Semi-milled and wholly milled rice: US$113.51 million (10.65%): Directly satisfies consumer and retail market demand for ready-to-consume white rice.
The HS 100600 category dominates US rice imports because it captures aromatic specialty rice flows, including jasmine, basmati, and Asian short-grain varieties shipped as already-processed white rice.
As stated by Grand View Research's US rice market outlook, aromatic rice categories continue to grow on retail grocery diversification and the expansion of ethnic cuisine in US food service channels.
Key signals shaping rice type imports in the USA in 2025:
- Aromatic specialty leadership: Jasmine rice (long-grain aromatic from Thailand) and basmati rice (long-grain aromatic from India and Pakistan) anchor the premium aromatic segment, with Thai jasmine commanding pricing premiums across US retail and food service channels.
- Brown rice consumer growth: HS 100620 brown rice imports reflect rising US consumer preference for whole-grain, fiber-rich rice varieties tied to wellness trends and reformulated retail packaged-food products.
- Paddy rice for domestic millers: HS 100610 paddy rice imports (US$129.11 million) supply US-based rice millers facing reduced domestic crop volumes, supporting the country's industrial rice-processing capacity through 2025-2026.
USA imports rice from which countries?
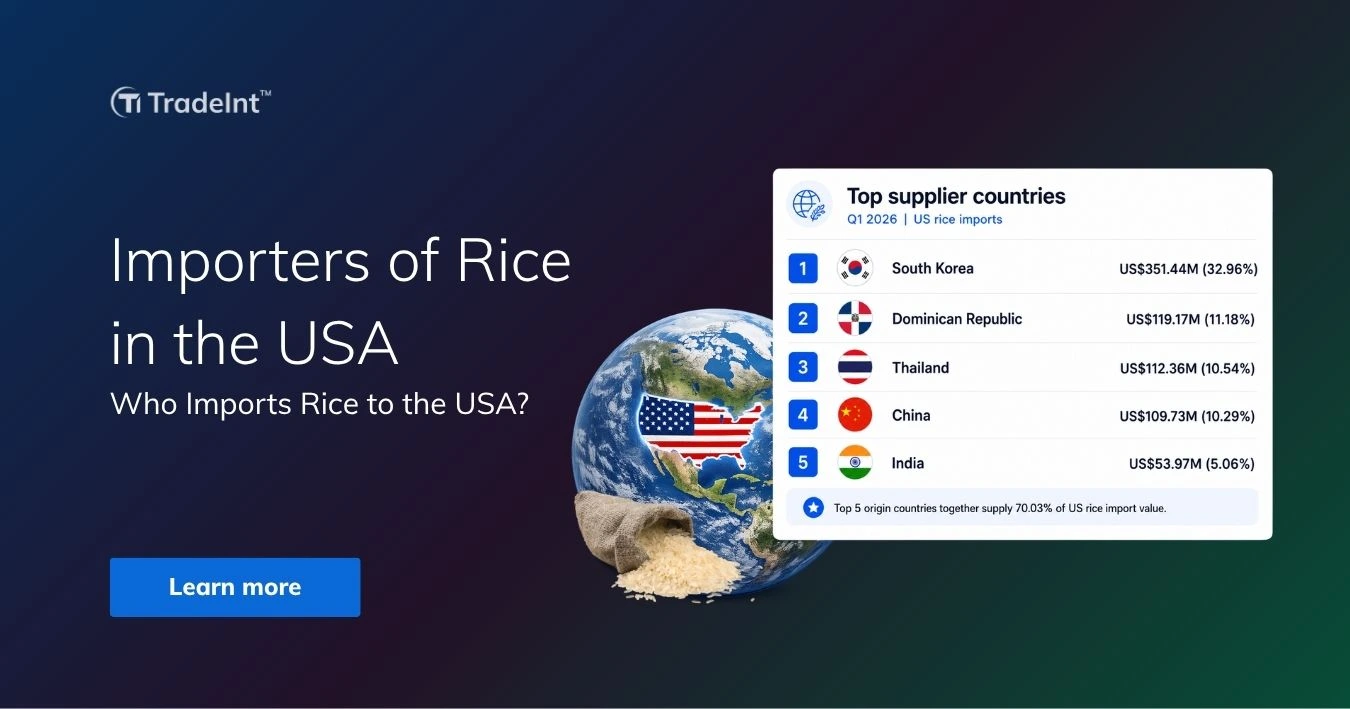
The US imports rice most heavily from South Korea at US$351.44 million (32.96%), the Dominican Republic at US$119.17 million (11.18%), and Thailand at US$112.36 million (10.54%) in Q1 2026, with China at US$109.73 million (10.29%) and India at US$53.97 million (5.06%) completing the top 5 origin countries. The top-5 origin blocks together supply 70.03% of the US rice import value.
Top 5 rice import partners to the US in Q1 2026:
- South Korea - US$351.44 million (32.96%): Anchors the market as the largest supplier of premium imported rice varieties.
- Dominican Republic - US$119.17 million (11.18%): Provides a critical regional trade partnership and efficient, close-proximity Caribbean logistical delivery.
- Thailand - US$112.36 million (10.54%): Supplies high-value aromatic specialty rice like Jasmine to satisfy diverse culinary demands.
- China - US$109.73 million (10.29%): Stabilizes pricing and bulk supply chains through highly competitive volume options.
- India - US$53.97 million (5.06%): Meets specific domestic market demands for premium traditional varieties like Basmati rice.
✔ Lite ✔ Pro ✔ Premium ✔ EnterpriseTradeInt is a global trade data platform covering 200+ countries and 80+ customs sources. Learn about TradeInt →
🇺🇸 Use TradeInt To Gain Higher Clarity in Rice Import-Export Movement Between the US and Top Trade Partners
From South Korea's premium rice lane to Thailand's jasmine flow, TradeInt's US import-export hub surfaces importer names, exporter records, port details, and shipment values across 200+ global markets.
Explore past trade statistical data insights between the US and top countries by HS code/product name
South Korea exporting rice to the US reflects the country's role as the major supplier of short-grain and medium-grain rice for the US Korean and Japanese cuisine markets, including premium sushi-grade rice and Asian retail grocery channels. Thailand's 10.54% share is anchored by jasmine rice, while India's 5.06% share is concentrated in basmati rice categories.
According to the USDA Economic Research Service rice market outlook, US rice imports continue to grow primarily on aromatic and specialty long-grain demand that US domestic production cannot fully satisfy.
Key signals shaping US rice origin flows in 2025-2026:
- South Korea premium leadership: South Korea's structural #1 position reflects deep US demand for medium-grain and short-grain premium rice varieties used in retail, restaurant, and ready-meal manufacturing across Korean-American and broader Asian-American consumer segments.
- Thailand aromatic specialty role: Thailand's 10.54% share is concentrated in HS 100630 jasmine rice exports, supplying US retail grocery brands, food service operators, and packaged-meal manufacturers across mainstream and specialty channels.
- India basmati anchor: US rice imports from India are dominated by aromatic long-grain basmati varieties (covered under HS 100630), with India's broader role as the world's largest rice exporter (25.0 million tons globally per USDA) supporting consistent US-bound supply.
- Vietnam supplementary flow: Vietnam, while outside the Q1 2026 top 5, contributes notable supplementary volumes of broken rice and long-grain rice into US industrial food manufacturing channels, particularly through Gulf Coast and West Coast port lanes.
How to find rice buyers in the USA?
The fastest way to find potential rice buyers in the USA is through a global trade data intelligence platform like TradeInt, the platform's optimized trade data engine that classifies every US import and export company by HS Code. Below is an easy 4-step process every trade professional can take to start the buyer-finding process easily with a trade data intelligence platform like TradeInt:
- Start with TradeInt's Global Trade Database Search to preview historical US rice importers by HS code, shipment value, and origin country. This is the only data source that confirms a company is actually importing rice (not just listed in a directory).
- Cross-validate with B2B marketplaces and government directories to fill in business model, stated procurement preferences, and contact-form access points.
- Layer industry association and LinkedIn data to identify the specific procurement or sourcing manager inside each confirmed buyer organization.
- Validate again with TradeInt to confirm shipment recency before outreach; a buyer who imported heavily 18 months ago but stopped is a different prospect than a buyer with monthly shipments through Q1 2026.

Find importers and exporters in the USA by HS code using trade record search database on TradeInt
Conclusion
Q1 2026 US rice imports concentrate around three structural blocks: a top-5 importer roster led by DAESANG AMERICA INC (16.04%) and MAPEI CARIBE INC GUAYNABO (11.03%), an HS 1006 product mix dominated by HS 100600 (69.32%) and HS 100610 paddy rice (12.11%), and an origin tier anchored by South Korea (32.96%) plus Thailand, China, and India for aromatic specialty varieties.
Access TradeInt here to unlock more country-level statistical trade data insights on 200+ global markets.
Frequently asked questions
What is the most popular rice in the United States?
The most popular rice in the United States is long-grain rice, accounting for the majority of US consumption and imports. Per USDA, US long-grain rice imports hit a record 43.0 million cwt in 2025/26, led by aromatic varieties like Thai jasmine and Indian basmati alongside domestic Southern long-grain production.
What kind of rice is used in the United States?
US consumers and food manufacturers use long-grain rice (most common, jasmine and basmati varieties), medium-grain rice (used for sushi and Korean cuisine, sourced largely from South Korea), short-grain rice, and brown rice. Per TradeInt's HS 1006 Q1 2026 data, milled white rice (HS 100630) anchors retail consumption.
Where do the USA import rice from?
The USA imports rice mainly from South Korea (US$351.44M, 32.96%), Dominican Republic (US$119.17M, 11.18%), Thailand (US$112.36M, 10.54%), China (US$109.73M, 10.29%), and India (US$53.97M, 5.06%) in Q1 2026, according to TradeInt's US Import Data and BoL Database.
Does America export a lot of rice?
Yes, America exports a significant volume of rice. Per the USDA Rice Outlook, US all-rice exports are projected at 94.0 million cwt in 2025/26, 4% above the prior year. The US is among the world's top 5 rice exporters, with Pakistan, Senegal, and India also playing major global roles.
Other relevant articles about Import & Export in the U.S.
- Importers of garments in USA: Where does US import apparel?
- Importers of sportswear in USA 2026: Top buyers & partners
- American oil imports by country Q1/2026: Top US oil sources
- Who are the top US export partners by country in Q1/2026?
- What are the US top export items in Q1/2026?
- US import data 2026: Top imports & source countries
- US export data 2026: Export products & destination markets