US import data: Key highlights (Jan to May 2026)
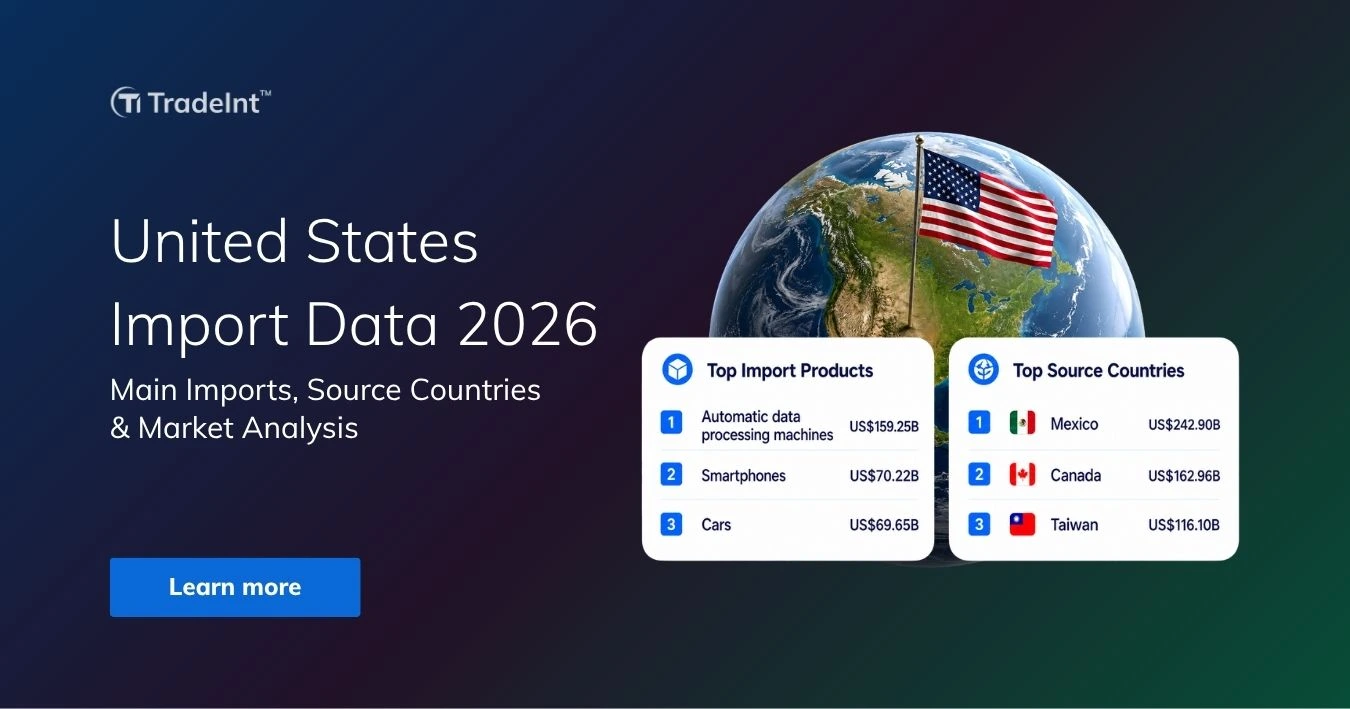
- Automatic data processing machines are the top US imports at US$159.25 billion, ahead of smartphones at US$70.22 billion and cars at US$69.65 billion, based on TradeInt's US import data.
- Mexico is the largest US import partner at US$242.90 billion, followed by Canada at US$162.96 billion and Taiwan at US$116.10 billion, from TradeInt's US import data.
- US imports from China slipped to fourth place at US$104.17 billion, as Taiwan and Vietnam picked up shares in strong computing and electronics demand.
- US imports climbed sharply in May 2026, with total imports reaching US$395.26 billion and capital-goods imports hitting a record US$128.00 billion, according to official trade figures.
US import analysis: How does the US import market perform in 2026?
The US import market strengthened through the first half of 2026, with monthly import values climbing from US$7.87 billion in January to US$9.14 billion in May, based on TradeInt's US import data. Values swung between months but finished higher, carried by strong appetite for computing and electronics goods.
US imports reached US$395.26 billion in May 2026, and the goods and services deficit widened to US$77.59 billion as inbound flows outpaced exports.
US import growth in 2026 is being led by computing hardware rather than broad consumer demand, with AI-related goods making up 23% of US imports in 2025 and climbing 73% from 2023.
Meanwhile, container volumes reached 2.24 million TEUs in May 2026, up 14.9% over the year, and are set to hit a record 2.47 million TEUs in July, according to the National Retail Federation and Hackett Associates. Importers moved goods early to secure inventory ahead of the peak season, which lifts near-term volumes but is expected to ease later in the year.
Here are the highlights shaping US import performance in 2026:
- Capital-goods spending hit a peak: US capital-goods imports reached a record US$128.00 billion in May 2026, driven by heavy business investment in computing equipment.
- The deficit widened on strong imports: The US goods and services deficit reached US$77.59 billion in May 2026 as inbound flows outpaced exports.
- Port traffic is set to fall after summer: Import volumes are forecast to decline from August through November 2026 once the early stocking run is over, pointing to a softer second half.

TradeInt is a global trade data platform providing access to over 10 billion verified import and export records. Its coverage spans over 200 countries and more than 80 customs data sources.
This article provides an overview of US imports. Use TradeInt to explore more detailed trade records and continue tracking this market as new data becomes available. Search US import records →
📥 Preview TradeInt's Real US Import Data from Historical Transactions
Preview US import records, covering HS codes, shipment values, importers, and transaction dates across product categories and partner countries.
Preview here: US historical trade data & bill of lading records by year and HS code
US import products: What are the main US imports?
Based on TradeInt's US import data until May 2026, the main US imports are automatic data processing machines at US$159.25 billion, smartphones at US$70.22 billion, and cars at US$69.65 billion. These three products lead the US import basket by value.
Crude petroleum, computer parts, returned US goods, vehicle parts, blood products, medicaments, and integrated circuits fill out the top 10. The mix shows a basket led by computing hardware, consumer electronics, vehicles, and energy.
What are the top US imports in 2026?
- Automatic data processing machines (HS 8471) - US$159.25 billion: computers and servers, the largest US import, lifted by data-centre demand.
- Smartphones and telecom apparatus (HS 8517) - US$70.22 billion: finished handsets and network equipment for the US consumer market.
- Cars (HS 8703) - US$69.65 billion: passenger vehicles, a core consumer import across major auto partners.
- Crude petroleum (HS 2709) - US$62.28 billion: crude oil feeding US refineries despite strong domestic output.
- Computer parts and accessories (HS 8473) - US$56.89 billion: components supporting data-processing and office machinery.
✔ Lite ✔ Pro ✔ Premium ✔ EnterpriseTradeInt is a global trade data platform covering 200+ countries and 80+ customs sources. Learn about TradeInt →
🖥️ Detailed Analysis of US Top Import Products on TradeInt
Automatic data processing equipment (HS 8471) leads at US$88.27 billion, with Mexico supplying the majority through nearshore IT hardware plants. See the detailed analysis of each sector of the top 10 US imported products ranked by value, leading supplier, and HS code on TradeInt.
Read more: US top import products in Q1 2026
The rise in US imports is concentrated in computing hardware, not spread across the basket. The growth in data-processing imports is tied specifically to processing units for data centres rather than general demand, which is why one category now sets the direction of total US imports.
Among the top US imports by product, semiconductor imports climbed to US$11.89 billion and computer accessories to US$19.41 billion in 05/2026, according to BEA. On the other hand, imports outside technology stayed firm rather than surging, with crude oil at US$15.10 billion and pharmaceutical preparations at US$16.49 billion that month.
Key points about the US import market in 2026:
- Semiconductors led the monthly gain: Semiconductor imports rose US$1.03 billion in a single month to US$11.89 billion in May 2026, the clearest sign of computing-driven demand.
- Energy imports held steady: Crude oil imports reached US$15.10 billion in May 2026, confirming that US refineries keep drawing on imported grades regardless of domestic output.
- Healthcare imports: Pharmaceutical-preparation imports climbed US$1.85 billion in May 2026 to US$16.49 billion, underlining steady US reliance on imported medical goods.
✔ Lite ✔ Pro ✔ Premium ✔ EnterpriseTradeInt is a global trade data platform covering 200+ countries and 80+ customs sources. Learn about TradeInt →
💊 TradeInt's US Pharmaceutical Import Breakdown
Sterile surgical materials and diagnostic tools (HS 300600) lead US pharmaceutical imports in 2025 with a 36.61% share. TradeInt breaks down the leading pharmaceutical products imported to the US, with values and HS-line detail.
Read more: What are the top pharmaceuticals imported to the US?
US imports by country: Where does the US import the most from?
From US import data on TradeInt in 2026, the US imports mainly from Mexico, Canada, and Taiwan. Mexico led at US$242.90 billion, Canada followed at US$162.96 billion, and Taiwan came third at US$116.10 billion.
China, Vietnam, South Korea, Germany, Japan, Thailand, and India complete the top 10 US import partners. The list shows a supply base shifting toward North American nearshoring and Asian chip suppliers, with US imports from China falling in the ranking.
Top 5 US import partners from 01/2026 - 05/2026:
- Mexico (US$242.90 billion): the top US supplier, led by data processing machines and integrated auto flows.
- Canada (US$162.96 billion): a core partner supplying crude oil, cars, and natural gas.
- Taiwan (US$116.10 billion): a fast-rising chip and server supplier feeding US data centres.
- China (US$104.17 billion): still a major source, but down the ranking as sourcing shifts away.
- Vietnam (US$98.03 billion): a growing partner gaining share in electronics and consumer goods.
US sourcing is shifting away from China toward Taiwan, Vietnam, and nearshore production.
In early 2026, direct imports from China fell to about US$40 billion, from US$73.3 billion a year earlier, while imports from Taiwan roughly doubled to US$42.8 billion, according to Baker Institute research.
This diversification lowers US dependence on any one country, yet it ties a growing share of imports to the electronics cycle, since the fastest-rising partners mainly ship computing and telecom goods. Vietnam and Thailand illustrate the trend, drawing in more electronics assembly as buyers spread orders across Southeast Asia.
What stands out about US import partners in 2026:
- Taiwan overtook China on chips: Imports from Taiwan roughly doubled to US$42.8 billion in early 2026, moving it ahead of China as computing hardware demand rose.
- US imports from China stepped back: Direct inflows from China dropped to around US$40.0 billion from US$73.3 billion a year earlier, cutting its share of US imports.
- Southeast Asia led the shift: US imports from Vietnam reached US$35.3 billion and Thailand US$18.4 billion in early 2026, as electronics sourcing spread across the region.
✔ Lite ✔ Pro ✔ Premium ✔ EnterpriseTradeInt is a global trade data platform covering 200+ countries and 80+ customs sources. Learn about TradeInt →
🌍 TradeInt's Detailed Analysis of US Top Imports By Country In Q1 2026
Mexico leads US imports by country at US$138.03 billion in Q1 2026, driven by data processing equipment and integrated USMCA automotive flows. See the full country ranking and top products per corridor on TradeInt.
Read more: Where does the US import from? US imports by country Q1/2026
Who are the top 5 importers of the US?
The top US importers in 2026 are DHL Global Forwarding, Ubiquiti Inc, and Mercedes-Benz USA LLC, from TradeInt's list of verified buyers. These companies lead US import activity across logistics, technology hardware, and automotive.
Lastly, PBF Holding Company and Park West Gallery Concession cover petroleum refining and fine-art imports.
Top 5 US importers include:
- DHL Global Forwarding: a global freight forwarder managing international supply chains and multimodal logistics.
- Ubiquiti Inc: a technology hardware maker importing network equipment and wireless data devices.
- Mercedes Benz USA LLC: a primary automotive distributor importing luxury vehicles and OEM parts.
- PBF Holding Company LLC: an independent petroleum refiner importing crude oil and refined products.
- Park West Gallery Concession: a fine-art enterprise importing paintings, sculptures, and collectibles.
✔ Lite ✔ Pro ✔ Premium ✔ EnterpriseTradeInt is a global trade data platform covering 200+ countries and 80+ customs sources. Learn about TradeInt →
🔍 Preview DHL Global Forwarding's US Import Activity on TradeInt
DHL Global Forwarding is the top US importer by volume. Preview its transaction-date shipment records, including HS codes, product categories, and import corridors, on TradeInt's Bill of Lading database.
Check out: DHL Global Forwarding US import records on TradeInt
How to find and access US import data?
US import data can be accessed through three main sources, depending on the level of detail required.
Official government databases
For aggregated and publicly available statistics, businesses can use:
- USA Trade Online for monthly, annual, and historical import data by HS code, product, country, port, value, and volume.
- USITC DataWeb for US trade statistics, tariff information, and product-level import trends.
These sources are useful for market-level research but generally do not provide detailed importer, exporter, or shipment records.
Commercial trade data platforms
For company- and shipment-level data, businesses can use platforms such as TradeInt.
TradeInt allows users to search US import records by HS code, importer, exporter, product description, shipment date, port, and trade route. The data can be used to identify active importers, verify suppliers, monitor competitors, and analyze sourcing or shipment trends.
Request trial access from TradeInt today.
Automated Commercial Environment
The Automated Commercial Environment, or ACE, is the US government’s customs processing system. It is mainly used by importers, brokers, carriers, and other trade participants to submit documents and review data related to their own import activities.
Conclusion
US import data for 2026 shows a market built on computing hardware, vehicles, and energy. Automatic data processing machines led at US$159.25 billion, ahead of smartphones at US$70.22 billion and cars at US$69.65 billion, based on TradeInt's US import data. Mexico is the largest partner at US$242.90 billion, followed by Canada and Taiwan.
The wider picture is one of shifting supply chains and record capital-goods demand. US imports from China fell in the ranking; Taiwan and Vietnam rose on electronics and computing demand, and the Bureau of Economic Analysis reported total imports of US$395.26 billion in May 2026.
For deeper trade insights discovery, schedule a TradeInt platform demo for your business needs.
Frequently asked questions
What is the US's largest import?
The largest US import is automatic data processing machines (HS 8471), valued at US$159.25 billion until May 2026. This category covers computers and servers, and its lead reflects strong demand from the data-centre and AI buildout.
How much does the USA import in May 2026?
According to the Bureau of Economic Analysis, the US imported US$395.26 billion in goods and services in May 2026, with capital-goods imports reaching a record US$128.00 billion. The goods and services trade deficit widened to US$77.59 billion that month as imports outpaced exports.
Which country imports the most to the US?
Mexico sends the most imports to the US, at US$242.90 billion in 2026, recorded by TradeInt. Canada follows at US$162.96 billion and Taiwan at US$116.10 billion, with US imports from China down in fourth place at US$104.17 billion.
Other relevant articles about Import & Export in the U.S.
- Importers of garments in USA: Where does US import apparel?
- Importers of sportswear in USA 2026: Top buyers & partners
- American oil imports by country Q1/2026: Top US oil sources
- Who are the top US export partners by country in Q1/2026?
- What are the US top export items in Q1/2026?
- US export data 2026: Export products & destination markets
- Importers of rice in the USA: Who imports rice to the USA?