Key takeaways about US exports by country
- Mexico is the largest US export partner in Q1 2026 at US$92.93 billion (15.47% share), driven by machine parts (HS 8473, US$9.04B), computers (HS 8471, US$8.78B), refined petroleum (HS 2710, US$6.26B), motor vehicle parts (HS 8708), and integrated circuits (HS 8542) flowing into cross-border manufacturing.
- The UK and Switzerland anchor US precious-metals export flow, with combined gold (HS 7108) exports of US$31.74 billion in Q1 2026 - the UK received US$11.01 billion (30.48% of UK total) and Switzerland US$20.74 billion (79.61% of Swiss total).
- The May 2026 Trump-Xi summit is reshaping US-China trade, with China committing to US$17 billion in annual US agricultural purchases through 2028, 200 Boeing 737 aircraft, and the resumption of beef, poultry, and energy product imports, per NPR's post-summit reporting.
US exports by country: Who are the top US export partners?
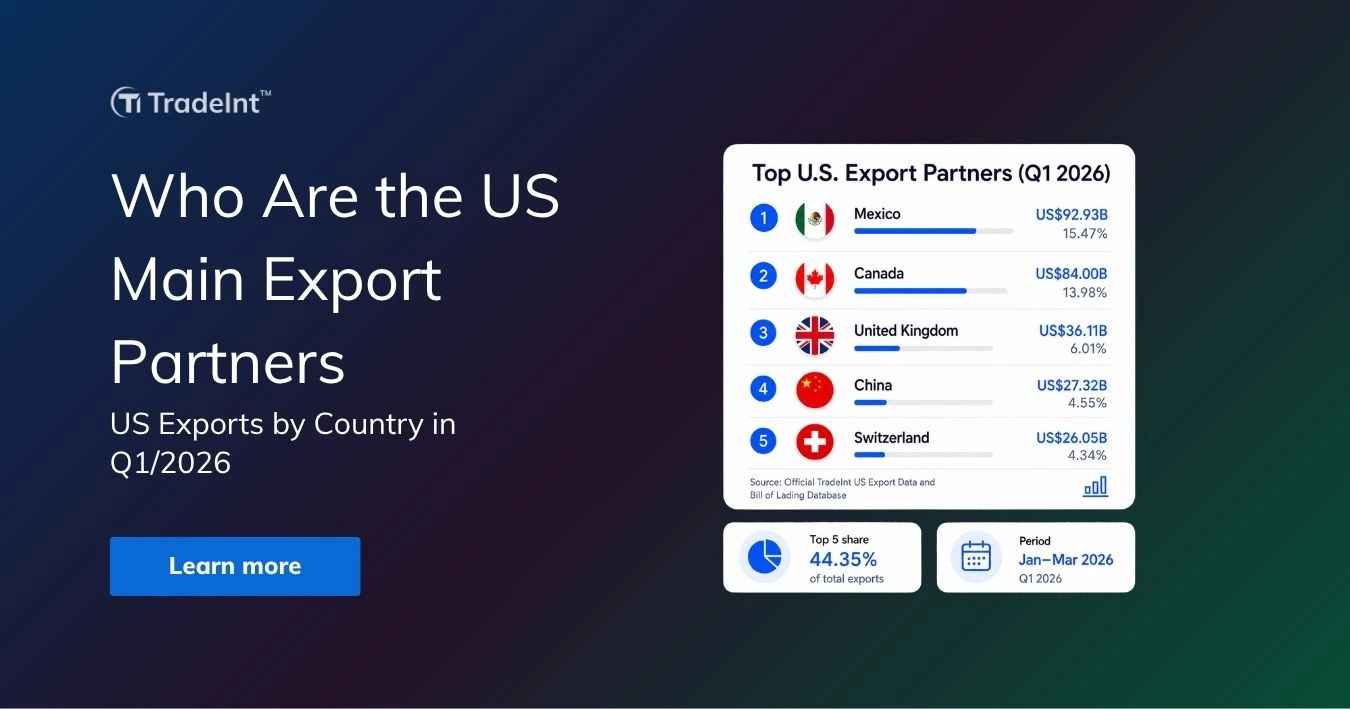
The US main export partners are Mexico, with exporting value of US$92.93 billion (15.47% share), Canada at US$84.00 billion (13.98%), and the United Kingdom at US$36.11 billion (6.01%) in Q1 2026, sourced from TradeInt's Official US Export Data and Bill of Lading Database.
North American USMCA partners anchor the top tier, while the UK leads European partners, and China holds the fourth slot as US export flow recalibrates after the May 2026 Trump-Xi summit.
Top 5 US exports by country of destination in Q1 2026:
- Mexico - US$92.93 billion (15.47%): Top destination for IT hardware, USMCA automotive components, and refined energy products.
- Canada - US$84.00 billion (13.98%): Cross-border manufacturing anchor for commercial trucks, automotive parts, and refined fuels.
- United Kingdom - US$36.11 billion (6.01%): Top European destination, led by gold and precious metals, plus civilian aircraft.
- China - US$27.32 billion (4.55%): Recalibrating market after the May 2026 Trump-Xi summit, with agricultural and aircraft purchase commitments through 2028.
- Switzerland - US$26.05 billion (4.34%): Concentrated gold and precious metals destination, with 79.61% of exports under HS 7108.
 ✔ U.S. Import & Export Trade Data
🇺🇸 Map US Exporters by Destination Country on TradeInt
200+ countries import from the US in Q1 2026 across every 4-digit HS code. TradeInt's US trade data hub surfaces verified exporter names, shipment values, ports, and Bill of Lading records by destination.
Access now: US import export trade statistics overview by year
Top #1 US export partner: Mexico at US$92.93 billion
According to TradeInt's Q1 2026 verified US export records, Mexico imports the most from the US through machine parts (HS 8473) at US$9.04 billion (9.73%), computers (HS 8471) at US$8.78 billion (9.44%), and refined petroleum (HS 2710) at US$6.26 billion (6.74%).
The HS mix reflects deep cross-border manufacturing integration, with US IT components feeding Mexican electronics assembly and refined fuels supporting industrial energy demand, supplemented by motor vehicle parts (HS 8708) and integrated circuits (HS 8542).
Top 5 exports from the US to Mexico in Q1 2026:
- HS 8473 - Machine parts: US$9.04 billion (9.73%): Powers cross-border electronics and computer manufacturing assembly.
- HS 8471 - Computers: US$8.78 billion (9.44%): Drives digital infrastructure and business computing capabilities.
- HS 2710 - Refined petroleum: US$6.26 billion (6.74%): Fuels transportation and industrial energy needs nationwide.
- HS 8708 - Motor vehicle parts: US$4.32 billion (4.65%): Integrates vital North American automotive production lines.
- HS 8542 - Integrated circuits: US$3.70 billion (3.98%): Feeds crucial components into high-tech manufacturing.
Mexico has solidified its position as the largest US export partner by capturing rising shares of the bilateral trade flow. LSEG analysis on Mexico's manufacturing hub status confirms Mexico's role as the central North American manufacturing platform for electronics, automotive, and medical devices, with deep US supply-chain integration concentrated along the Bajío corridor and northern border states.
Here are some market highlights of US-Mexico export flows in Q1 2026:
- Record share of US goods trade: Reporting from Vallarta Daily confirms Mexico reached a record share of US goods trade in early 2026, with cross-border IT, automotive, and refined petroleum flows continuing to expand.
- Tech export boom: Mexico News Daily reported Mexico's tech export market share within the US destination mix continued to climb through 2025-2026, with electronics manufacturing capacity expanding across Guadalajara, Monterrey, and Tijuana.
- IT-energy combination: The top-5 mix (machine parts, computers, refined petroleum, motor vehicle parts, integrated circuits) shows Mexico's role spans both high-tech manufacturing feedstock and energy supply, anchoring two of the largest cross-border trade lanes in North America.
✔ U.S. Import & Export Trade Data
📈 United States Export Data Analysis 2025 by TradeInt
Mexico led US export destinations in 2025 at US$336.19 billion (15%+ share), powered by TradeInt's US trade database. See the full year breakdown across every US export partner and HS chapter.
Explore further: United States Export Data 2025
Top #2 US export partner: Canada at US$84 billion
TradeInt's Q1 2026 verified shipment records indicated that Canada imports the most from the US via commercial trucks (HS 8704) at US$3.94 billion (4.69%), motor vehicle parts (HS 8708) at US$3.64 billion (4.34%), and refined petroleum (HS 2710) at US$3.06 billion (3.64%).
These categories highlight Canada's role as a deeply integrated USMCA logistics and automotive supply partner, complemented by re-exports (HS 9880) and finished motor vehicles (HS 8703).
Top 5 exports from the US to Canada in Q1 2026:
- HS 8704 - Commercial trucks: US$3.94 billion (4.69%): Supplies commercial trucks for North American logistics.
- HS 8708 - Motor vehicle parts: US$3.64 billion (4.34%): Feeds cross-border automotive manufacturing supply chains.
- HS 2710 - Refined petroleum: US$3.06 billion (3.64%): Provides refined fuel for transportation and heating.
- HS 9880 - Special trade shipments: US$3.01 billion (3.59%): Simplifies special cross-border trade and shipping regulations.
- HS 8703 - Passenger vehicles: US$2.89 billion (3.44%): Meets consumer demand for reliable passenger vehicles.
Canada-US trade dynamics are entering a structural recalibration phase ahead of the July 2026 USMCA joint review. Analysis from the C.D. Howe Institute observes that the US-Canada trade surplus dynamic has been shrinking ahead of the 2026 CUSMA review, with both energy and automotive flows experiencing volume recalibration through 2025 and into early 2026.
Here are some market highlights of US-Canada export flows in Q1 2026:
- Energy strategic priority: The Canadian Energy Centre identifies strengthening US energy ties as a top priority for Canada's energy future, supporting continued cross-border refined petroleum and energy product flows.
- March 2026 trade balance: CBC's March 2026 trade-balance reporting documented an evolving Canada-US bilateral picture, with refined petroleum and automotive flows providing the structural backbone for the US$84 billion quarterly export value.
- Automotive cluster integration: Combined HS 8704, 8708, and 8703 shipments to Canada totaled US$10.47 billion in Q1 2026, reflecting the depth of Ontario-Michigan-Ohio automotive cluster integration that has anchored North American auto production since NAFTA.
Top #3 US export partner: United Kingdom at US$36.11 billion
The United Kingdom imports the most from the US via gold (HS 7108) at US$11.01 billion (30.48%), silver and platinum group metals (HS 7106) at US$6.08 billion (16.84%), and civilian aircraft (HS 8800) at US$2.71 billion (7.49%), data verified from TradeInt's global trade data platform.
The precious metals concentration anchors London's role as the global bullion trading hub, complemented by aerospace exports and US energy product flows under HS 2711 and HS 2710.
Top 5 exports from the US to the United Kingdom in Q1 2026:
- HS 7108 - Gold: US$11.01 billion (30.48%): Acts as a major financial investment asset.
- HS 7106 - Silver and platinum group: US$6.08 billion (16.84%): Supplies industrial electronics and precious metal markets.
- HS 8800 - Civilian aircraft: US$2.71 billion (7.49%): Supports commercial aviation fleets and aerospace maintenance.
- HS 2711 - Petroleum gases: US$1.62 billion (4.48%): Ensures critical energy security and power generation.
- HS 2710 - Refined petroleum: US$1.51 billion (4.18%): Fuels commercial transport and industrial operations.
✔ Lite ✔ Pro ✔ Premium ✔ Enterprise
🔧 Use TradeInt's 1SMART Search to Preview Past HS 7106 US Export Records
US$6.08 billion in HS 7106 (silver and platinum group metals) flowed to the UK in Q1 2026, with China and Switzerland as additional buyers. Preview US HS 7106 exporters, buyers, port origin, and shipment-level depth.
Preview: US historical export trade records by HS code 7106
UK-US trade dynamics shifted notably through Q1 2026, with London emerging as the leading European destination for US precious metals. The UK Government's United States Trade and Investment Factsheet May 2026 confirms the US remains the UK's largest single trading partner, with bilateral trade reaching record levels across goods and services in 2025.
Here are some market highlights of US-UK export flows in Q1 2026:
- Precious metals concentration: Combined HS 7108 and HS 7106 shipments to the UK reached US$17.09 billion (47.32% of total US exports to the UK), anchoring London's position as the world's primary bullion clearing and storage hub.
- Aircraft maintenance demand: HS 8800 shipments of US$2.71 billion reflect UK airline fleet renewal cycles, with Boeing wide-body and narrow-body deliveries supplementing the established Rolls-Royce maintenance ecosystem.
- Energy supply diversification: Combined HS 2711 and HS 2710 flows of US$3.13 billion provide UK industrial and consumer energy security, particularly across LNG-receiving terminals at Isle of Grain, Milford Haven, and Dragon.
Top #4 US export partner: China at US$27.32 billion
From the US trade database on TradeInt, China imports the most from the US through gold (HS 7108) at US$6.02 billion (10.31%), integrated circuits (HS 8542) at US$4.64 billion (7.95%), and civilian aircraft (HS 8800) at US$4.10 billion (7.02%).
The mix reflects China's appetite for US financial-asset gold flows, advanced semiconductor inputs, and Boeing fleet expansion, complemented by soybeans (HS 1201) at US$3.55 billion (6.09%) and telecommunications equipment (HS 8517).
Top 5 exports from the US to China in Q1 2026:
- HS 7108 - Gold: US$6.02 billion (10.31%): Meets high demand for investment and luxury manufacturing.
- HS 8542 - Integrated circuits: US$4.64 billion (7.95%): Drives consumer electronics assembly and tech supply chains.
- HS 8800 - Civilian aircraft: US$4.10 billion (7.02%): Expands commercial aviation fleets and transport capacity.
- HS 1201 - Soybeans: US$3.55 billion (6.09%): Secures agricultural food supplies and animal feed.
- HS 8517 - Telecommunications equipment: US$2.15 billion (3.69%): Powers telecommunications infrastructure and mobile network growth.
China's position as the #4 US export destination is being actively reshaped by the May 14-15, 2026, Trump-Xi summit in Beijing. NPR's post-summit analysis confirmed that under the agreed framework, China committed to purchasing at least US$17 billion of US agricultural products annually through 2028, alongside resumed imports of US beef, poultry, and aircraft, plus reinstated energy product purchases (oil and LNG).
Q1 2026 export data already reflects parts of this recalibration. CNBC's May 18 summit readout documented Boeing's commitment to 200 737 aircraft from China and the resumption of US soybean and beef export licenses, with HS 1201 soybeans already contributing US$3.55 billion to Q1 2026 China-bound exports and HS 8800 aircraft adding US$4.10 billion.
US top #5 export partner: Switzerland at US$26.05 billion
Switzerland imports the most from the US through gold (HS 7108) at US$20.74 billion (79.61%), making the country an extraordinarily concentrated destination for US precious-metals flows.
The remaining top-5 mix includes immunological products (HS 3002) at US$528.62 million, silver and platinum jewelry inputs (HS 7115) at US$523.80 million, finished jewelry (HS 7113) at US$415.66 million, and special trade shipments (HS 9880) at US$407.13 million.
Top 5 exports from the US to Switzerland in Q1 2026:
- HS 7108 - Gold: US$20.74 billion (79.61%): Anchors international banking, wealth storage, and refining.
- HS 3002 - Immunological products: US$528.62 million (2.03%): Advanced biomedical research and global healthcare solutions.
- HS 7115 - Articles of precious metal: US$523.80 million (2.01%): Supplies specialized inputs for high-end precision manufacturing.
- HS 7113 - Finished jewelry: US$415.66 million (1.60%): Feeds the luxury jewelry and retail sector.
- HS 9880 - Special trade shipments: US$407.13 million (1.56%): Streamlines special customs processing for high-value trade.
Switzerland's role as a precious-metals destination intensified through Q1 2026 as global gold flows redirected through Swiss refining hubs.
Kitco's April 2026 analysis reported that Switzerland's own gold exports rose 30% as investors sought safe-haven assets amid global volatility, reflecting the country's central role in refining, vaulting, and re-distributing global gold flows, including those originating from US vaults.
Here are some market highlights of US-Switzerland export flows in Q1 2026:
- Gold flow dominance: Switzerland's 79.61% concentration of US exports under HS 7108 makes it the most gold-concentrated US export destination among the top 10 partners, reflecting the country's role as the world's primary gold refining and re-export hub.
- Pharma and luxury complement: Combined HS 3002, HS 7115, and HS 7113 shipments of US$1.47 billion reflect Switzerland's pharmaceutical research ecosystem (Basel-Zurich axis) and luxury watchmaking sector (Jura Arc) absorbing US biomedical and precious-metal inputs.
- Safe-haven demand acceleration: Kitco's April 2026 reporting confirms Swiss gold export volumes climbed 30% as global investors and central banks routed precious-metals flows through Swiss vaulting and refining infrastructure during the global volatility window.
✔ Lite ✔ Pro ✔ Premium ✔ Enterprise
🌐 TradeInt's Universal Trade Data Covers Up to 97% Global Trade Lanes
Tracking trade movement in Switzerland, China, or Mexico, and any other product categories, TradeInt's universal trade data intelligence layers verified Bill of Lading, shipment value, and destination-country depth across every 4-digit HS code and 200+ countries.
Explore more: TradeInt's universal trade data feature
Did US exports grow or decline entering 2026? US exports growth trends QoQ 2025-2026
From TradeInt's quarterly US export data, US exports climbed 15.72% from US$519.29 billion in Q1 2025 to a record US$600.92 billion in Q1 2026, marking the highest quarterly value across the five-quarter window. The peak quarter within the period is Q1 2026 itself (+6.69% QoQ), capping a year of accelerating outbound flows interrupted only by a brief Q3 2025 mid-year cooling.
Quarterly US export value trends across the past five quarters:
- Q1 2025: US$519.29 billion (+1.77% QoQ): Stable opening quarter with steady demand across capital goods and commodity categories.
- Q2 2025: US$549.66 billion (+5.85% QoQ): Accelerated growth as commodity values strengthened and international buyer demand widened.
- Q3 2025: US$540.30 billion (-1.70% QoQ): Brief mid-year cooling reflecting typical seasonal logistics patterns.
- Q4 2025: US$563.22 billion (+4.24% QoQ): Strong year-end recovery anchored by peak fourth-quarter export logistics.
- Q1 2026: US$600.92 billion (+6.69% QoQ): Record-breaking quarter driven by precious metals, energy products, and aerospace category growth.
Cross-checking the quarterly trend against monthly data confirms the upward trajectory. The US Bureau of Economic Analysis March 2026 international trade release documented sustained US goods export growth through Q1 2026, with civilian aircraft, computers, capital goods, and precious metals categories anchoring the cycle's expansion.
Key signals from the five-quarter US export trend:
- Record quarterly peak: The US$600.92 billion Q1 2026 quarterly value is the highest in the five-quarter window, lifting the bilateral export trajectory to a new structural high against every US export by country partner.
- North American anchor: Mexico (US$92.93B) and Canada (US$84.00B) collectively absorbed US$176.93 billion (29.45%) of total Q1 2026 US exports, confirming USMCA partners as the structural floor of US outbound trade.
- China summit forward effect: The May 2026 Trump-Xi summit's US$17 billion annual agricultural commitment, plus Boeing 737 order pipeline positions HS 1201 soybeans, HS 8800 aircraft, and HS 2711 LNG as growth categories for Q2 2026 onward export expansion to China.
Conclusion
Q1 2026 U.S. exports by country concentrate around three blocks: an integrated North American USMCA core (Mexico US$92.93B, Canada US$84.00B), a precious-metals-led European cluster (UK US$36.11B, Switzerland US$26.05B), and an Asia tier rebalancing around the post-summit U.S.-China trade framework (China US$27.32B, Japan US$20.08B).
Book a demo with TradeInt to unlock the latest US customs & shipment data on TradeInt.
Frequently asked questions
Where do most USA exports go?
Most USA exports go to Mexico in Q1 2026, with US$92.93 billion (15.47% share), followed by Canada at US$84.00 billion (13.98%) and the United Kingdom at US$36.11 billion (6.01%). North American USMCA partners absorbed nearly 30% of total US exports, according to official TradeInt's verified US export data.
What are the US main exports to China?
The US main exports to China in Q1 2026 are gold (HS 7108) at US$6.02 billion (10.31%), integrated circuits (HS 8542) at US$4.64 billion (7.95%), civilian aircraft (HS 8800) at US$4.10 billion (7.02%), soybeans (HS 1201) at US$3.55 billion (6.09%), and telecommunications equipment (HS 8517) at US$2.15 billion (3.69%), from official TradeInt's global trade record database.